
|
Sto Express Co., Ltd. (002468.sz) Avaliação DCF |
Totalmente Editável: Adapte-Se Às Suas Necessidades No Excel Ou Planilhas
Design Profissional: Modelos Confiáveis E Padrão Da Indústria
Pré-Construídos Para Uso Rápido E Eficiente
Compatível com MAC/PC, totalmente desbloqueado
Não É Necessária Experiência; Fácil De Seguir
STO Express Co., Ltd. (002468.SZ) Bundle
Explore as perspectivas financeiras da STO Express Co., Ltd. (002468SZ) com nossa calculadora DCF amigável! Digite suas previsões de crescimento, margens e despesas para calcular o valor intrínseco da STO Express Co., Ltd. (002468SZ) e aprimore sua abordagem de investimento.
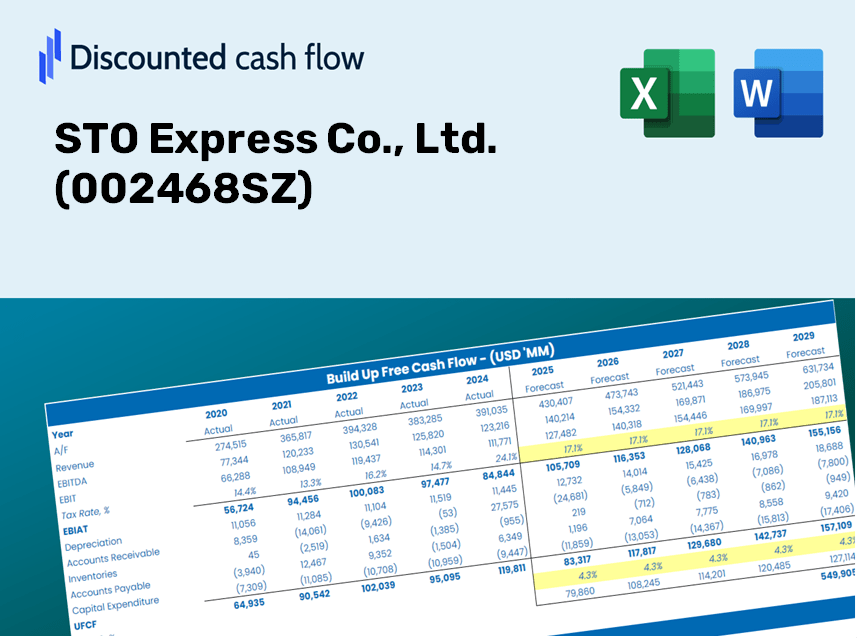
Discounted Cash Flow (DCF) - (USD MM)
| Year | AY1 2020 |
AY2 2021 |
AY3 2022 |
AY4 2023 |
AY5 2024 |
FY1 2025 |
FY2 2026 |
FY3 2027 |
FY4 2028 |
FY5 2029 |
|---|---|---|---|---|---|---|---|---|---|---|
| Revenue | 21,566.1 | 25,254.8 | 33,670.7 | 40,923.6 | 47,169.5 | 57,456.1 | 69,986.1 | 85,248.6 | 103,839.4 | 126,484.6 |
| Revenue Growth, % | 0 | 17.1 | 33.32 | 21.54 | 15.26 | 21.81 | 21.81 | 21.81 | 21.81 | 21.81 |
| EBITDA | 948.9 | 196.6 | 1,974.1 | 2,477.1 | 3,753.2 | 2,878.7 | 3,506.4 | 4,271.1 | 5,202.6 | 6,337.1 |
| EBITDA, % | 4.4 | 0.7785 | 5.86 | 6.05 | 7.96 | 5.01 | 5.01 | 5.01 | 5.01 | 5.01 |
| Depreciation | 478.5 | 958.8 | 1,198.3 | 1,805.7 | 2,165.4 | 2,134.7 | 2,600.3 | 3,167.3 | 3,858.1 | 4,699.4 |
| Depreciation, % | 2.22 | 3.8 | 3.56 | 4.41 | 4.59 | 3.72 | 3.72 | 3.72 | 3.72 | 3.72 |
| EBIT | 470.4 | -762.2 | 775.8 | 671.4 | 1,587.8 | 743.9 | 906.2 | 1,103.8 | 1,344.5 | 1,637.7 |
| EBIT, % | 2.18 | -3.02 | 2.3 | 1.64 | 3.37 | 1.29 | 1.29 | 1.29 | 1.29 | 1.29 |
| Total Cash | 4,558.5 | 4,717.1 | 2,225.0 | 2,865.7 | 2,431.7 | 6,731.7 | 8,199.7 | 9,987.9 | 12,166.0 | 14,819.2 |
| Total Cash, percent | .0 | .0 | .0 | .0 | .0 | .0 | .0 | .0 | .0 | .0 |
| Account Receivables | 957.8 | 1,036.9 | 935.3 | 1,052.9 | 1,340.8 | 1,923.6 | 2,343.1 | 2,854.1 | 3,476.6 | 4,234.7 |
| Account Receivables, % | 4.44 | 4.11 | 2.78 | 2.57 | 2.84 | 3.35 | 3.35 | 3.35 | 3.35 | 3.35 |
| Inventories | 64.5 | 54.5 | 43.6 | 87.8 | 84.6 | 119.3 | 145.3 | 177.0 | 215.6 | 262.6 |
| Inventories, % | 0.29902 | 0.21595 | 0.12943 | 0.21454 | 0.17931 | 0.20765 | 0.20765 | 0.20765 | 0.20765 | 0.20765 |
| Accounts Payable | 2,507.1 | 2,513.3 | 3,261.1 | 3,441.5 | 3,801.3 | 5,484.9 | 6,681.0 | 8,138.0 | 9,912.7 | 12,074.4 |
| Accounts Payable, % | 11.63 | 9.95 | 9.69 | 8.41 | 8.06 | 9.55 | 9.55 | 9.55 | 9.55 | 9.55 |
| Capital Expenditure | -2,398.5 | -2,873.3 | -3,591.7 | -2,856.5 | -3,254.1 | -5,406.0 | -6,584.9 | -8,020.9 | -9,770.1 | -11,900.8 |
| Capital Expenditure, % | -11.12 | -11.38 | -10.67 | -6.98 | -6.9 | -9.41 | -9.41 | -9.41 | -9.41 | -9.41 |
| Tax Rate, % | 20.22 | 20.22 | 20.22 | 20.22 | 20.22 | 20.22 | 20.22 | 20.22 | 20.22 | 20.22 |
| EBITAT | 220.4 | -694.5 | 614.5 | 547.1 | 1,266.7 | 563.1 | 685.9 | 835.5 | 1,017.7 | 1,239.6 |
| Depreciation | ||||||||||
| Changes in Account Receivables | ||||||||||
| Changes in Inventories | ||||||||||
| Changes in Accounts Payable | ||||||||||
| Capital Expenditure | ||||||||||
| UFCF | -214.7 | -2,672.0 | -918.5 | -485.2 | 253.1 | -1,642.2 | -2,548.2 | -3,103.9 | -3,780.8 | -4,605.3 |
| WACC, % | 4.06 | 4.43 | 4.33 | 4.35 | 4.33 | 4.3 | 4.3 | 4.3 | 4.3 | 4.3 |
| PV UFCF | ||||||||||
| SUM PV UFCF | -13,578.6 | |||||||||
| Long Term Growth Rate, % | 3.50 | |||||||||
| Free cash flow (T + 1) | -4,766 | |||||||||
| Terminal Value | -596,348 | |||||||||
| Present Terminal Value | -483,162 | |||||||||
| Enterprise Value | -496,741 | |||||||||
| Net Debt | 5,305 | |||||||||
| Equity Value | -502,046 | |||||||||
| Diluted Shares Outstanding, MM | 1,529 | |||||||||
| Equity Value Per Share | -328.28 |
Benefits of Choosing Our Services
- Authentic STO Express Financial Data: Access both historical and projected figures for precise evaluations.
- Customizable Parameters: Adjust WACC, tax rates, revenue growth, and capital expenditures to fit your analysis.
- Automated Calculations: Intrinsic value and NPV are computed in real-time.
- Scenario Analysis: Explore various scenarios to assess the future performance of STO Express Co., Ltd. (002468SZ).
- User-Friendly Interface: Designed for professionals while remaining accessible to newcomers.
Core Features
- 🔍 Real-Time STO Express Financials: Pre-loaded historical and forecasted data for STO Express Co., Ltd. (002468SZ).
- ✏️ Fully Adjustable Inputs: Modify all essential parameters (yellow cells) such as WACC, growth %, and tax rates.
- 📊 Comprehensive DCF Valuation: Integrated formulas calculate the intrinsic value of STO Express using the Discounted Cash Flow method.
- ⚡ Immediate Results: Visualize STO Express's valuation instantly after any adjustments.
- Scenario Analysis: Evaluate and compare results for different financial assumptions side-by-side.
How It Functions
- Download the Template: Gain immediate access to the Excel-based STO Express DCF Calculator for [002468SZ].
- Enter Your Assumptions: Modify the yellow-highlighted cells for growth rates, WACC, margins, and other variables.
- Instant Calculations: The model automatically recalculates the intrinsic value of STO Express.
- Test Various Scenarios: Experiment with different assumptions to assess potential changes in valuation.
- Analyze and Make Decisions: Leverage the results to inform your investment or financial analysis regarding [002468SZ].
Why Choose Our Calculator for STO Express Co., Ltd. (002468SZ)?
- Designed for Experts: A sophisticated tool tailored for analysts, CFOs, and consultants.
- Accurate Data: STO Express's historical and projected financial metrics pre-loaded for reliable analysis.
- Flexible Scenario Testing: Effortlessly simulate various forecasts and assumptions.
- Comprehensive Outputs: Automatically computes intrinsic value, NPV, and essential performance indicators.
- User-Friendly: Step-by-step guidance ensures a smooth experience throughout the process.
Who Can Benefit from STO Express Co., Ltd. (002468SZ)?
- Investors: Gain insights and make informed decisions with a reliable valuation tool tailored for the industry.
- Financial Analysts: Streamline your workflow with a customizable DCF model designed for efficiency.
- Consultants: Effortlessly modify the template for impactful client presentations and thorough reports.
- Finance Enthusiasts: Expand your knowledge of valuation strategies through practical, real-world scenarios.
- Educators and Students: Utilize this tool as a valuable resource for finance courses and hands-on learning experiences.
Contents of the Template
- Pre-Filled DCF Model: STO Express Co., Ltd.'s (002468SZ) financial data included for immediate application.
- WACC Calculator: Comprehensive calculations for the Weighted Average Cost of Capital.
- Financial Ratios: Analyze STO Express's profitability, leverage, and operational efficiency.
- Editable Inputs: Adjust assumptions such as growth rates, profit margins, and CAPEX according to your scenarios.
- Financial Statements: Access annual and quarterly reports for in-depth analysis.
- Interactive Dashboard: Effortlessly visualize essential valuation metrics and outcomes.
Disclaimer
All information, articles, and product details provided on this website are for general informational and educational purposes only. We do not claim any ownership over, nor do we intend to infringe upon, any trademarks, copyrights, logos, brand names, or other intellectual property mentioned or depicted on this site. Such intellectual property remains the property of its respective owners, and any references here are made solely for identification or informational purposes, without implying any affiliation, endorsement, or partnership.
We make no representations or warranties, express or implied, regarding the accuracy, completeness, or suitability of any content or products presented. Nothing on this website should be construed as legal, tax, investment, financial, medical, or other professional advice. In addition, no part of this site—including articles or product references—constitutes a solicitation, recommendation, endorsement, advertisement, or offer to buy or sell any securities, franchises, or other financial instruments, particularly in jurisdictions where such activity would be unlawful.
All content is of a general nature and may not address the specific circumstances of any individual or entity. It is not a substitute for professional advice or services. Any actions you take based on the information provided here are strictly at your own risk. You accept full responsibility for any decisions or outcomes arising from your use of this website and agree to release us from any liability in connection with your use of, or reliance upon, the content or products found herein.