
|
Kingenta Ecological Engineering Group Co., Ltd. (002470.sz) Avaliação DCF |
Totalmente Editável: Adapte-Se Às Suas Necessidades No Excel Ou Planilhas
Design Profissional: Modelos Confiáveis E Padrão Da Indústria
Pré-Construídos Para Uso Rápido E Eficiente
Compatível com MAC/PC, totalmente desbloqueado
Não É Necessária Experiência; Fácil De Seguir
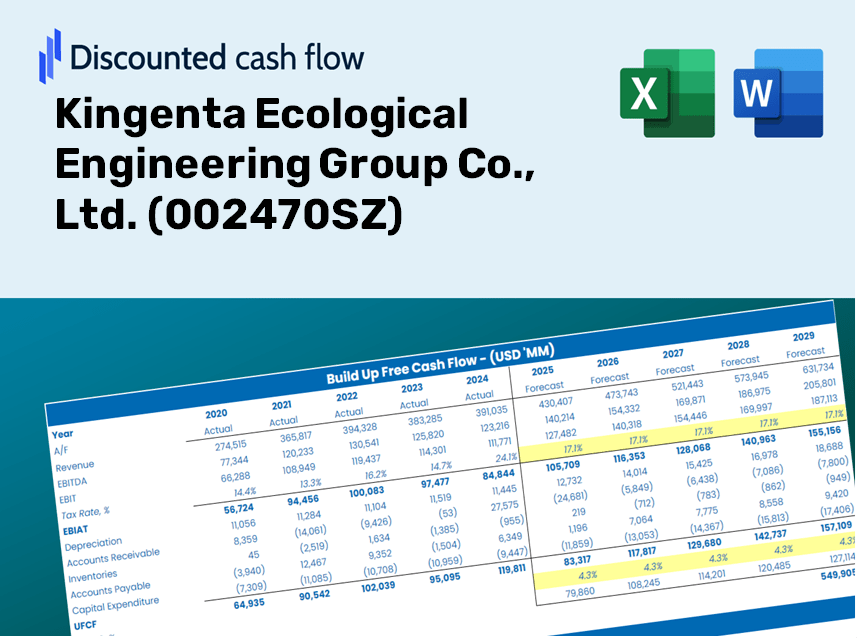
Kingenta Ecological Engineering Group Co., Ltd. (002470.SZ) Bundle
Descubra o verdadeiro valor do Kingenta Ecological Engineering Group Co., Ltd. (002470SZ) com nossa calculadora DCF avançada! Ajuste as principais suposições, explore vários cenários e avalie os efeitos das mudanças na avaliação de Kingenta - tudo dentro de um único modelo do Excel.
Discounted Cash Flow (DCF) - (USD MM)
| Year | AY1 2020 |
AY2 2021 |
AY3 2022 |
AY4 2023 |
AY5 2024 |
FY1 2025 |
FY2 2026 |
FY3 2027 |
FY4 2028 |
FY5 2029 |
|---|---|---|---|---|---|---|---|---|---|---|
| Revenue | 9,355.0 | 9,316.0 | 9,976.7 | 8,548.9 | 8,328.1 | 8,115.3 | 7,908.0 | 7,705.9 | 7,509.1 | 7,317.2 |
| Revenue Growth, % | 0 | -0.41699 | 7.09 | -14.31 | -2.58 | -2.55 | -2.55 | -2.55 | -2.55 | -2.55 |
| EBITDA | -2,253.0 | 441.8 | -60.3 | -45.0 | 871.5 | -162.4 | -158.3 | -154.2 | -150.3 | -146.4 |
| EBITDA, % | -24.08 | 4.74 | -0.60405 | -0.5269 | 10.46 | -2 | -2 | -2 | -2 | -2 |
| Depreciation | 574.1 | 606.6 | 616.2 | 574.9 | 598.9 | 531.4 | 517.8 | 504.6 | 491.7 | 479.1 |
| Depreciation, % | 6.14 | 6.51 | 6.18 | 6.72 | 7.19 | 6.55 | 6.55 | 6.55 | 6.55 | 6.55 |
| EBIT | -2,827.1 | -164.7 | -676.4 | -619.9 | 272.6 | -693.8 | -676.1 | -658.8 | -642.0 | -625.6 |
| EBIT, % | -30.22 | -1.77 | -6.78 | -7.25 | 3.27 | -8.55 | -8.55 | -8.55 | -8.55 | -8.55 |
| Total Cash | 853.0 | 862.1 | 833.2 | 1,067.9 | 888.8 | 809.7 | 789.0 | 768.9 | 749.2 | 730.1 |
| Total Cash, percent | .0 | .0 | .0 | .0 | .0 | .0 | .0 | .0 | .0 | .0 |
| Account Receivables | 4,896.8 | 534.1 | 1,809.3 | 947.8 | 745.5 | 1,562.2 | 1,522.3 | 1,483.4 | 1,445.5 | 1,408.6 |
| Account Receivables, % | 52.34 | 5.73 | 18.14 | 11.09 | 8.95 | 19.25 | 19.25 | 19.25 | 19.25 | 19.25 |
| Inventories | 1,627.3 | 2,549.6 | 2,684.0 | 2,555.2 | 2,497.7 | 2,135.1 | 2,080.5 | 2,027.4 | 1,975.6 | 1,925.1 |
| Inventories, % | 17.39 | 27.37 | 26.9 | 29.89 | 29.99 | 26.31 | 26.31 | 26.31 | 26.31 | 26.31 |
| Accounts Payable | 1,846.7 | 1,130.2 | 921.0 | 1,954.6 | 1,503.3 | 1,331.2 | 1,297.2 | 1,264.1 | 1,231.8 | 1,200.3 |
| Accounts Payable, % | 19.74 | 12.13 | 9.23 | 22.86 | 18.05 | 16.4 | 16.4 | 16.4 | 16.4 | 16.4 |
| Capital Expenditure | -279.9 | -228.3 | -257.7 | -153.3 | -430.1 | -243.2 | -236.9 | -230.9 | -225.0 | -219.2 |
| Capital Expenditure, % | -2.99 | -2.45 | -2.58 | -1.79 | -5.16 | -3 | -3 | -3 | -3 | -3 |
| Tax Rate, % | 41.56 | 41.56 | 41.56 | 41.56 | 41.56 | 41.56 | 41.56 | 41.56 | 41.56 | 41.56 |
| EBITAT | -2,879.8 | -184.7 | -692.7 | -626.3 | 159.3 | -636.1 | -619.9 | -604.0 | -588.6 | -573.6 |
| Depreciation | ||||||||||
| Changes in Account Receivables | ||||||||||
| Changes in Inventories | ||||||||||
| Changes in Accounts Payable | ||||||||||
| Capital Expenditure | ||||||||||
| UFCF | -7,263.0 | 2,917.6 | -1,953.0 | 1,819.0 | 136.7 | -974.0 | -278.6 | -271.5 | -264.5 | -257.8 |
| WACC, % | 5.67 | 5.67 | 5.67 | 5.67 | 4.91 | 5.52 | 5.52 | 5.52 | 5.52 | 5.52 |
| PV UFCF | ||||||||||
| SUM PV UFCF | -1,814.8 | |||||||||
| Long Term Growth Rate, % | 2.00 | |||||||||
| Free cash flow (T + 1) | -263 | |||||||||
| Terminal Value | -7,477 | |||||||||
| Present Terminal Value | -5,717 | |||||||||
| Enterprise Value | -7,532 | |||||||||
| Net Debt | 2,867 | |||||||||
| Equity Value | -10,398 | |||||||||
| Diluted Shares Outstanding, MM | 3,279 | |||||||||
| Equity Value Per Share | -3.17 |
Benefits of Choosing Our Services
- Flexible Input Options: Modify key assumptions (growth %, margins, WACC) effortlessly to explore various financial scenarios.
- Industry-Specific Data: Pre-loaded financial insights from Kingenta Ecological Engineering Group Co., Ltd. (002470SZ) to facilitate your analysis.
- Automatic DCF Calculations: Our template computes Net Present Value (NPV) and intrinsic value automatically for your convenience.
- Customizable and Professional Design: An elegant Excel model that can be tailored to meet your specific valuation requirements.
- Designed for Analysts and Investors: Perfect for evaluating projections, confirming strategies, and enhancing efficiency.
Key Features
- Authentic Financial Data for Kingenta (002470SZ): Access reliable historical financial records and future estimates.
- Adjustable Forecast Parameters: Customize highlighted fields such as WACC, growth percentages, and profit margins.
- Real-Time Calculations: Immediate updates for DCF, Net Present Value (NPV), and cash flow assessments.
- User-Friendly Visual Dashboard: Intuitive charts and summaries to easily interpret your valuation results.
- Designed for All Skill Levels: A straightforward and accessible format suitable for investors, CFOs, and consultants alike.
How It Functions
- Step 1: Download the Excel spreadsheet.
- Step 2: Examine the pre-filled Kingenta Ecological Engineering data (historical and forecasted).
- Step 3: Modify key assumptions (highlighted in yellow) according to your analysis.
- Step 4: Observe the automatic recalculations for Kingenta’s intrinsic value.
- Step 5: Utilize the results for investment strategies or reporting purposes.
Why Choose Kingenta's Financial Calculator?
- All-in-One Solution: Combines DCF, WACC, and comprehensive financial ratio analyses in a single tool.
- Flexible Inputs: Easily modify the highlighted fields to explore different financial scenarios.
- In-Depth Analysis: Automatically computes the intrinsic value and Net Present Value for Kingenta (002470SZ).
- Ready-to-Use Data: Comes with historical and projected data for precise calculations right from the start.
- High-Quality Standards: Designed for financial analysts, investors, and business consultants alike.
Who Can Benefit from This Product?
- Individual Investors: Gain insights to make informed choices regarding investments in Kingenta Ecological Engineering Group Co., Ltd. (002470SZ).
- Financial Analysts: Enhance valuation methodologies with comprehensive financial models tailored for the company.
- Consultants: Provide clients with timely and precise valuation analyses for Kingenta's offerings.
- Business Owners: Learn how large enterprises like Kingenta are valued to inform your own business strategies.
- Finance Students: Acquire hands-on experience with valuation techniques through real-time data and case studies related to Kingenta (002470SZ).
Contents of the Template
- Operating and Balance Sheet Data: Pre-populated historical data and forecasts for Kingenta Ecological Engineering Group Co., Ltd. (002470SZ), covering revenue, EBITDA, EBIT, and capital expenditures.
- WACC Calculation: A dedicated sheet for calculating the Weighted Average Cost of Capital (WACC), including key parameters such as Beta, risk-free rate, and share price.
- DCF Valuation (Unlevered and Levered): Customizable Discounted Cash Flow models that provide an assessment of intrinsic value with comprehensive calculations.
- Financial Statements: Pre-loaded annual and quarterly financial statements to facilitate thorough analysis.
- Key Ratios: Includes ratios related to profitability, leverage, and efficiency specifically for Kingenta Ecological Engineering Group Co., Ltd. (002470SZ).
- Dashboard and Charts: A visual overview of valuation results and underlying assumptions for straightforward analysis.
Disclaimer
All information, articles, and product details provided on this website are for general informational and educational purposes only. We do not claim any ownership over, nor do we intend to infringe upon, any trademarks, copyrights, logos, brand names, or other intellectual property mentioned or depicted on this site. Such intellectual property remains the property of its respective owners, and any references here are made solely for identification or informational purposes, without implying any affiliation, endorsement, or partnership.
We make no representations or warranties, express or implied, regarding the accuracy, completeness, or suitability of any content or products presented. Nothing on this website should be construed as legal, tax, investment, financial, medical, or other professional advice. In addition, no part of this site—including articles or product references—constitutes a solicitation, recommendation, endorsement, advertisement, or offer to buy or sell any securities, franchises, or other financial instruments, particularly in jurisdictions where such activity would be unlawful.
All content is of a general nature and may not address the specific circumstances of any individual or entity. It is not a substitute for professional advice or services. Any actions you take based on the information provided here are strictly at your own risk. You accept full responsibility for any decisions or outcomes arising from your use of this website and agree to release us from any liability in connection with your use of, or reliance upon, the content or products found herein.