
|
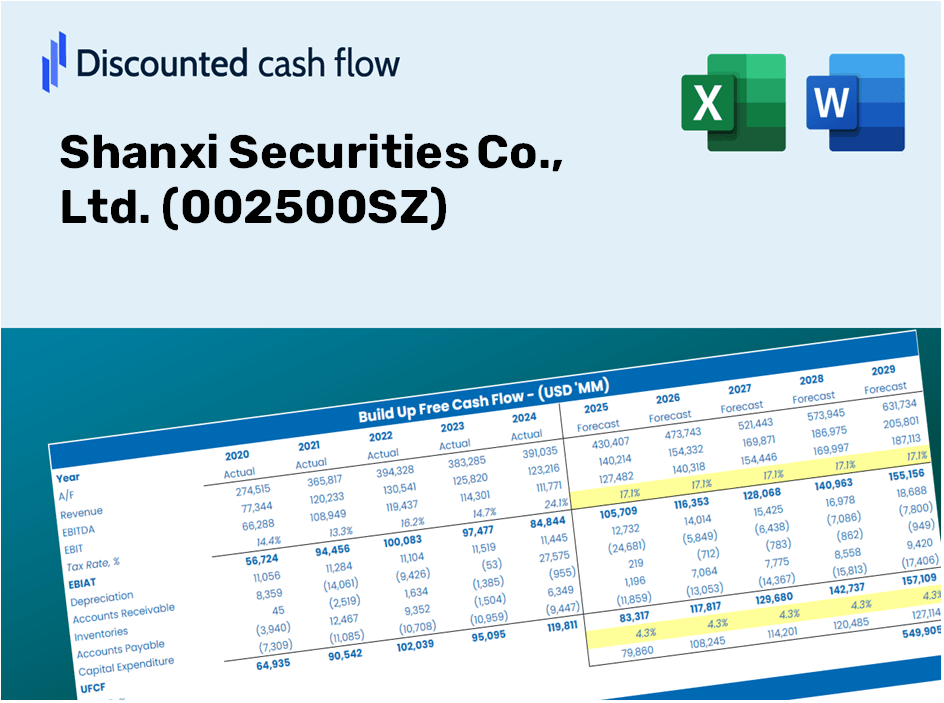
Shanxi Securities Co., Ltd. (002500.sz) Avaliação DCF |
Totalmente Editável: Adapte-Se Às Suas Necessidades No Excel Ou Planilhas
Design Profissional: Modelos Confiáveis E Padrão Da Indústria
Pré-Construídos Para Uso Rápido E Eficiente
Compatível com MAC/PC, totalmente desbloqueado
Não É Necessária Experiência; Fácil De Seguir
Shanxi Securities Co., Ltd. (002500.SZ) Bundle
Simplifique a Avaliação Shanxi Securities Co., Ltd. (002500SZ) com esta calculadora DCF personalizável! Com a Real Shanxi Securities Co., Ltd. (002500SZ) e entradas de previsão ajustáveis, você pode testar cenários e descobrir o valor justo Shanxi Securities Co., Ltd. (002500SZ) em minutos.
Discounted Cash Flow (DCF) - (USD MM)
| Year | AY1 2020 |
AY2 2021 |
AY3 2022 |
AY4 2023 |
AY5 2024 |
FY1 2025 |
FY2 2026 |
FY3 2027 |
FY4 2028 |
FY5 2029 |
|---|---|---|---|---|---|---|---|---|---|---|
| Revenue | 3,342.2 | 3,994.1 | 4,137.6 | 3,442.9 | 3,141.4 | 3,122.2 | 3,103.1 | 3,084.1 | 3,065.2 | 3,046.5 |
| Revenue Growth, % | 0 | 19.5 | 3.59 | -16.79 | -8.76 | -0.61195 | -0.61195 | -0.61195 | -0.61195 | -0.61195 |
| EBITDA | .0 | .0 | 2,019.2 | 2,154.6 | .0 | 695.5 | 691.3 | 687.0 | 682.8 | 678.6 |
| EBITDA, % | 0 | 0 | 48.8 | 62.58 | 0 | 22.28 | 22.28 | 22.28 | 22.28 | 22.28 |
| Depreciation | 2,695.4 | 3,350.0 | 3,750.5 | 277.9 | 259.5 | 1,695.4 | 1,685.0 | 1,674.7 | 1,664.4 | 1,654.2 |
| Depreciation, % | 80.65 | 83.87 | 90.64 | 8.07 | 8.26 | 54.3 | 54.3 | 54.3 | 54.3 | 54.3 |
| EBIT | -2,695.4 | -3,350.0 | -1,731.3 | 1,876.6 | -259.5 | -999.8 | -993.7 | -987.6 | -981.6 | -975.6 |
| EBIT, % | -80.65 | -83.87 | -41.84 | 54.51 | -8.26 | -32.02 | -32.02 | -32.02 | -32.02 | -32.02 |
| Total Cash | 32,938.2 | 40,038.2 | 40,079.9 | 8,145.7 | 39,815.0 | 3,122.2 | 3,103.1 | 3,084.1 | 3,065.2 | 3,046.5 |
| Total Cash, percent | .0 | .0 | .0 | .0 | .0 | .0 | .0 | .0 | .0 | .0 |
| Account Receivables | 110.3 | 63.0 | 108.2 | .0 | 10,763.4 | 671.2 | 667.1 | 663.0 | 659.0 | 655.0 |
| Account Receivables, % | 3.3 | 1.58 | 2.62 | 0 | 342.63 | 21.5 | 21.5 | 21.5 | 21.5 | 21.5 |
| Inventories | 17,418.8 | 169.0 | 282.4 | .0 | .0 | 693.5 | 689.2 | 685.0 | 680.8 | 676.7 |
| Inventories, % | 521.18 | 4.23 | 6.82 | 0 | 0 | 22.21 | 22.21 | 22.21 | 22.21 | 22.21 |
| Accounts Payable | 90.8 | 480.6 | 975.2 | 366.7 | 93.2 | 324.3 | 322.3 | 320.3 | 318.4 | 316.4 |
| Accounts Payable, % | 2.72 | 12.03 | 23.57 | 10.65 | 2.97 | 10.39 | 10.39 | 10.39 | 10.39 | 10.39 |
| Capital Expenditure | -115.6 | -179.6 | -199.8 | -215.1 | -205.4 | -159.7 | -158.7 | -157.7 | -156.8 | -155.8 |
| Capital Expenditure, % | -3.46 | -4.5 | -4.83 | -6.25 | -6.54 | -5.11 | -5.11 | -5.11 | -5.11 | -5.11 |
| Tax Rate, % | 13.73 | 13.73 | 13.73 | 13.73 | 13.73 | 13.73 | 13.73 | 13.73 | 13.73 | 13.73 |
| EBITAT | -2,012.9 | -2,694.9 | -1,488.1 | 1,514.8 | -223.9 | -816.0 | -811.0 | -806.0 | -801.1 | -796.2 |
| Depreciation | ||||||||||
| Changes in Account Receivables | ||||||||||
| Changes in Inventories | ||||||||||
| Changes in Accounts Payable | ||||||||||
| Capital Expenditure | ||||||||||
| UFCF | -16,871.5 | 18,162.6 | 2,398.6 | 1,359.6 | -11,206.7 | 10,349.5 | 721.6 | 717.2 | 712.8 | 708.5 |
| WACC, % | 4.36 | 4.49 | 4.61 | 4.5 | 4.62 | 4.52 | 4.52 | 4.52 | 4.52 | 4.52 |
| PV UFCF | ||||||||||
| SUM PV UFCF | 12,356.5 | |||||||||
| Long Term Growth Rate, % | 2.00 | |||||||||
| Free cash flow (T + 1) | 723 | |||||||||
| Terminal Value | 28,715 | |||||||||
| Present Terminal Value | 23,024 | |||||||||
| Enterprise Value | 35,381 | |||||||||
| Net Debt | -39,815 | |||||||||
| Equity Value | 75,196 | |||||||||
| Diluted Shares Outstanding, MM | 3,559 | |||||||||
| Equity Value Per Share | 21.13 |
Benefits of Choosing Shanxi Securities Co., Ltd. (002500SZ)
- Comprehensive Financial Insights: Access detailed historical and projected financial data for precise evaluations.
- Customizable Parameters: Adjust variables such as discount rates, tax considerations, revenue forecasts, and capital investments.
- Dynamically Updated Calculations: Automatically calculates intrinsic value and net present value (NPV).
- Scenario Evaluations: Explore various scenarios to assess the future potential of Shanxi Securities.
- User-Friendly Interface: Designed for industry professionals while remaining approachable for new users.
Key Features
- Customizable Forecast Parameters: Adjust essential metrics such as revenue growth, EBITDA margin, and capital investments.
- Instant DCF Valuation: Automatically computes intrinsic value, NPV, and various financial outputs in real-time.
- High-Precision Accuracy: Leverages Shanxi Securities Co., Ltd.'s (002500SZ) actual financial data for more reliable valuation results.
- Effortless Scenario Analysis: Easily evaluate different assumptions and analyze the resulting impacts side by side.
- Efficiency Booster: Avoid the tedious process of constructing intricate valuation models from the ground up.
How It Operates
- Step 1: Download the Excel spreadsheet.
- Step 2: Examine the pre-loaded data for Shanxi Securities Co., Ltd. (002500SZ) (historical and forecasted).
- Step 3: Modify the key assumptions (highlighted in yellow) based on your insights.
- Step 4: Observe automatic updates for the intrinsic value of Shanxi Securities Co., Ltd. (002500SZ).
- Step 5: Utilize the results for making investment choices or for reporting purposes.
Why Opt for Shanxi Securities Co., Ltd. ([002500SZ])?
- Reliable Data: Authentic financial information for accurate valuation outcomes.
- Flexible Design: Modify essential metrics such as growth forecasts, WACC, and tax rates to align with your analysis.
- Efficiency Boost: Pre-configured calculations save you the hassle of starting from square one.
- Professional-Quality Resource: Tailored for use by investors, analysts, and financial consultants.
- Easy to Navigate: User-friendly interface and guided instructions ensure accessibility for everyone.
Who Should Utilize Our Services?
- Institutional Investors: Construct comprehensive and trustworthy valuation models for portfolio assessment.
- Corporate Finance Departments: Evaluate valuation scenarios to inform strategic decisions.
- Financial Consultants and Advisors: Deliver precise valuation insights for Shanxi Securities Co., Ltd. (002500SZ).
- Students and Educators: Leverage real-world data to enhance financial modeling skills and education.
- Market Enthusiasts: Gain insights into the valuation methodologies applied to companies like Shanxi Securities Co., Ltd. (002500SZ).
Contents of the Template
- Preloaded 002500SZ Data: Historical and projected financial metrics, encompassing revenue, EBIT, and capital expenditures.
- DCF and WACC Models: Advanced spreadsheets for determining intrinsic value and Weighted Average Cost of Capital.
- Editable Inputs: Yellow-highlighted cells for modifying revenue growth rates, tax rates, and discount rates.
- Financial Statements: Detailed annual and quarterly financial reports for in-depth analysis.
- Key Ratios: Metrics on profitability, leverage, and efficiency for performance assessment.
- Dashboard and Charts: Visual representations of valuation results and underlying assumptions.
Disclaimer
All information, articles, and product details provided on this website are for general informational and educational purposes only. We do not claim any ownership over, nor do we intend to infringe upon, any trademarks, copyrights, logos, brand names, or other intellectual property mentioned or depicted on this site. Such intellectual property remains the property of its respective owners, and any references here are made solely for identification or informational purposes, without implying any affiliation, endorsement, or partnership.
We make no representations or warranties, express or implied, regarding the accuracy, completeness, or suitability of any content or products presented. Nothing on this website should be construed as legal, tax, investment, financial, medical, or other professional advice. In addition, no part of this site—including articles or product references—constitutes a solicitation, recommendation, endorsement, advertisement, or offer to buy or sell any securities, franchises, or other financial instruments, particularly in jurisdictions where such activity would be unlawful.
All content is of a general nature and may not address the specific circumstances of any individual or entity. It is not a substitute for professional advice or services. Any actions you take based on the information provided here are strictly at your own risk. You accept full responsibility for any decisions or outcomes arising from your use of this website and agree to release us from any liability in connection with your use of, or reliance upon, the content or products found herein.