
|
Anhui Honglu Steel Construction Co., Ltd (002541.sz) DCF Avaliação |
Totalmente Editável: Adapte-Se Às Suas Necessidades No Excel Ou Planilhas
Design Profissional: Modelos Confiáveis E Padrão Da Indústria
Pré-Construídos Para Uso Rápido E Eficiente
Compatível com MAC/PC, totalmente desbloqueado
Não É Necessária Experiência; Fácil De Seguir
Anhui Honglu Steel Construction(Group) CO., LTD (002541.SZ) Bundle
Aprimore suas opções de investimento com a calculadora DCF (002541SZ)! Mergulhe em dados financeiros reais da Anhui Honglu Steel Construction (Group) CO., LTD, ajuste as previsões e despesas do crescimento e observe instantaneamente como essas modificações afetam o valor intrínseco da Companhia.
What You Will Receive
- Authentic 002541SZ Financial Data: Access to historical and projected figures for precise valuation.
- Customizable Inputs: Adjust parameters such as WACC, tax rates, revenue growth, and capital expenditures.
- Real-Time Calculations: Dynamic computation of intrinsic value and NPV.
- Scenario Testing: Analyze various scenarios to forecast Anhui Honglu Steel Construction's future performance.
- User-Friendly Interface: Designed for industry professionals while remaining easy for newcomers.
Key Features
- Comprehensive Historical Data: Anhui Honglu Steel's past financial statements and pre-filled projections.
- Customizable Inputs: Adjust WACC, tax rates, revenue growth, and EBITDA margins as needed.
- Real-Time Calculations: Instantly view the intrinsic value of Anhui Honglu Steel ([002541SZ]) as it updates live.
- Intuitive Visual Displays: Dashboard graphs showcase valuation outcomes and essential metrics.
- Designed for Precision: A reliable resource tailored for analysts, investors, and financial professionals.
How It Works
- Step 1: Download the prebuilt Excel template featuring Anhui Honglu Steel Construction(Group) CO., LTD's data.
- Step 2: Navigate through the pre-filled sheets to familiarize yourself with the essential metrics.
- Step 3: Adjust forecasts and assumptions in the editable yellow cells (WACC, growth, margins).
- Step 4: Instantly see the recalibrated results, including Anhui Honglu's intrinsic value.
- Step 5: Utilize the outputs to make informed investment decisions or create detailed reports.
Why Opt for This Tool?
- User-Friendly: Crafted for both novices and seasoned professionals.
- Customizable Parameters: Effortlessly adjust inputs to suit your analysis.
- Real-Time Feedback: Witness immediate updates to Anhui Honglu Steel's valuation as you tweak inputs.
- Pre-Configured: Comes with Anhui Honglu Steel's actual financial data for swift evaluations.
- Relied Upon by Experts: Employed by investors and analysts to make well-informed choices.
Who Can Benefit from Our Services?
- Industry Professionals: Develop comprehensive and accurate valuation models for investment analysis related to Anhui Honglu Steel Construction (002541SZ).
- Corporate Strategy Teams: Evaluate valuation scenarios to inform strategic decisions within the organization.
- Consultants and Financial Advisors: Offer clients precise valuation insights for Anhui Honglu Steel Construction (002541SZ).
- Students and Academics: Utilize real-world data to enhance learning and practice in financial modeling.
- Steel Industry Enthusiasts: Gain insights into how construction and steel companies like Anhui Honglu Steel Construction (002541SZ) are appraised in the market.
Contents of the Template
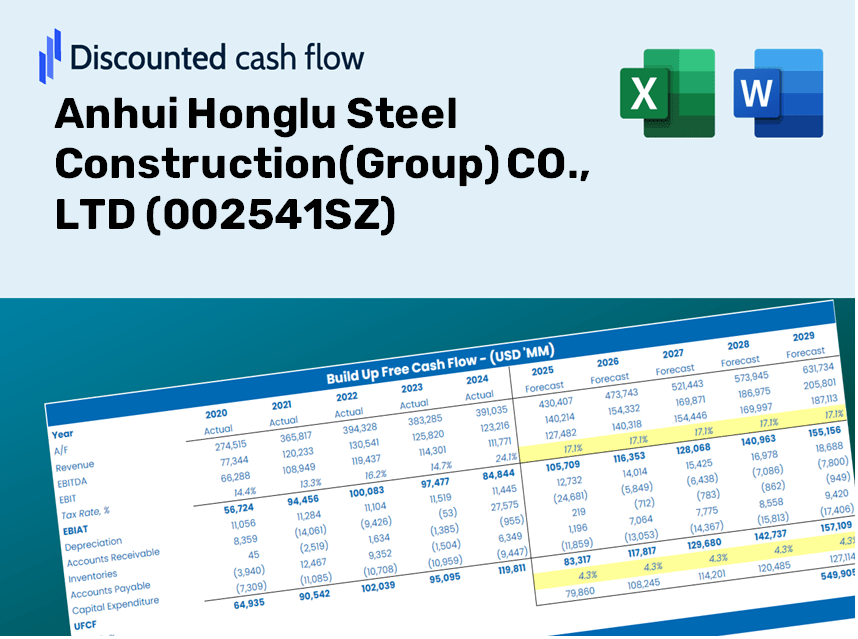
- Operating and Balance Sheet Data: Pre-filled historical data and forecasts for Anhui Honglu Steel Construction(Group) CO., LTD (002541SZ), including revenue, EBITDA, EBIT, and capital expenditures.
- WACC Calculation: A dedicated sheet for the Weighted Average Cost of Capital (WACC), featuring parameters such as Beta, risk-free rate, and share price.
- DCF Valuation (Unlevered and Levered): Customizable Discounted Cash Flow models that display intrinsic value along with detailed calculations.
- Financial Statements: Pre-loaded annual and quarterly financial statements to facilitate analysis.
- Key Ratios: Includes essential profitability, leverage, and efficiency ratios specific to Anhui Honglu Steel Construction(Group) CO., LTD (002541SZ).
- Dashboard and Charts: A visual overview of valuation outputs and assumptions to simplify result analysis.
Disclaimer
All information, articles, and product details provided on this website are for general informational and educational purposes only. We do not claim any ownership over, nor do we intend to infringe upon, any trademarks, copyrights, logos, brand names, or other intellectual property mentioned or depicted on this site. Such intellectual property remains the property of its respective owners, and any references here are made solely for identification or informational purposes, without implying any affiliation, endorsement, or partnership.
We make no representations or warranties, express or implied, regarding the accuracy, completeness, or suitability of any content or products presented. Nothing on this website should be construed as legal, tax, investment, financial, medical, or other professional advice. In addition, no part of this site—including articles or product references—constitutes a solicitation, recommendation, endorsement, advertisement, or offer to buy or sell any securities, franchises, or other financial instruments, particularly in jurisdictions where such activity would be unlawful.
All content is of a general nature and may not address the specific circumstances of any individual or entity. It is not a substitute for professional advice or services. Any actions you take based on the information provided here are strictly at your own risk. You accept full responsibility for any decisions or outcomes arising from your use of this website and agree to release us from any liability in connection with your use of, or reliance upon, the content or products found herein.