
|
China Zhonghua Geotechnical Engineering Group Co., Ltd. (002542.sz) DCF Avaliação |
Totalmente Editável: Adapte-Se Às Suas Necessidades No Excel Ou Planilhas
Design Profissional: Modelos Confiáveis E Padrão Da Indústria
Pré-Construídos Para Uso Rápido E Eficiente
Compatível com MAC/PC, totalmente desbloqueado
Não É Necessária Experiência; Fácil De Seguir
China Zhonghua Geotechnical Engineering Group Co., Ltd. (002542.SZ) Bundle
Seja você um investidor ou analista, esta calculadora DCF (002542SZ) é sua ferramenta preferida para uma avaliação precisa. Equipado com dados reais da China Zhonghua Geotechnical Engineering Group Co., Ltd., você pode ajustar as previsões e observar imediatamente os efeitos.
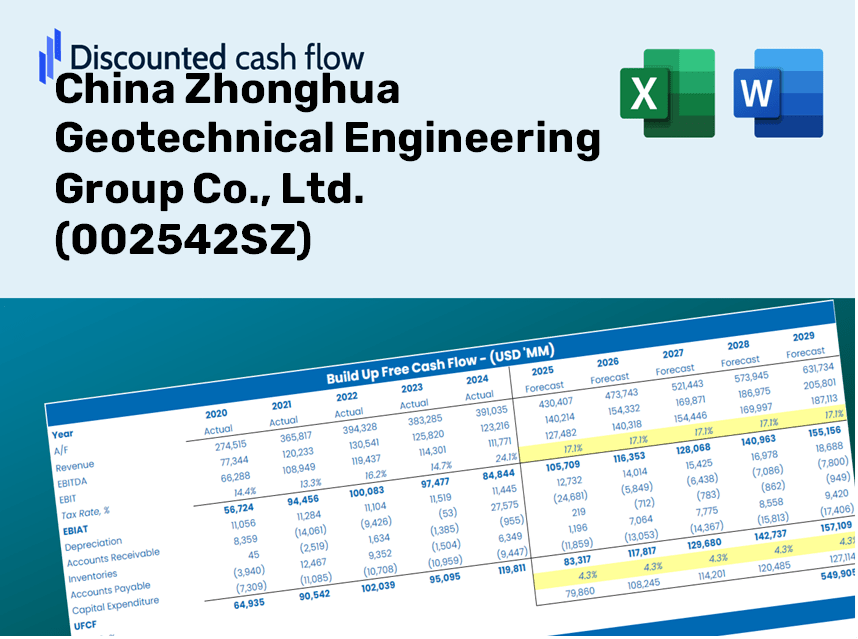
Discounted Cash Flow (DCF) - (USD MM)
| Year | AY1 2020 |
AY2 2021 |
AY3 2022 |
AY4 2023 |
AY5 2024 |
FY1 2025 |
FY2 2026 |
FY3 2027 |
FY4 2028 |
FY5 2029 |
|---|---|---|---|---|---|---|---|---|---|---|
| Revenue | 5,662.8 | 5,173.9 | 2,176.8 | 2,526.6 | 1,530.1 | 1,186.1 | 919.4 | 712.7 | 552.5 | 428.3 |
| Revenue Growth, % | 0 | -8.63 | -57.93 | 16.07 | -39.44 | -22.48 | -22.48 | -22.48 | -22.48 | -22.48 |
| EBITDA | 595.0 | -7.3 | -458.5 | -621.8 | -1,251.3 | -277.8 | -215.3 | -166.9 | -129.4 | -100.3 |
| EBITDA, % | 10.51 | -0.14123 | -21.06 | -24.61 | -81.78 | -23.42 | -23.42 | -23.42 | -23.42 | -23.42 |
| Depreciation | 227.9 | 188.5 | 199.8 | 149.9 | 129.0 | 74.0 | 57.4 | 44.5 | 34.5 | 26.7 |
| Depreciation, % | 4.02 | 3.64 | 9.18 | 5.93 | 8.43 | 6.24 | 6.24 | 6.24 | 6.24 | 6.24 |
| EBIT | 367.1 | -195.8 | -658.3 | -771.7 | -1,380.3 | -351.8 | -272.7 | -211.4 | -163.9 | -127.0 |
| EBIT, % | 6.48 | -3.78 | -30.24 | -30.54 | -90.21 | -29.66 | -29.66 | -29.66 | -29.66 | -29.66 |
| Total Cash | 1,238.8 | 1,016.6 | 578.9 | 884.3 | 457.2 | 315.5 | 244.6 | 189.6 | 147.0 | 113.9 |
| Total Cash, percent | .0 | .0 | .0 | .0 | .0 | .0 | .0 | .0 | .0 | .0 |
| Account Receivables | 6,633.3 | 6,455.7 | 5,380.7 | 5,045.2 | 3,352.4 | 1,186.1 | 919.4 | 712.7 | 552.5 | 428.3 |
| Account Receivables, % | 117.14 | 124.77 | 247.19 | 199.68 | 219.1 | 100 | 100 | 100 | 100 | 100 |
| Inventories | 106.9 | 87.0 | 110.0 | 44.6 | 28.3 | 29.0 | 22.5 | 17.4 | 13.5 | 10.5 |
| Inventories, % | 1.89 | 1.68 | 5.05 | 1.77 | 1.85 | 2.45 | 2.45 | 2.45 | 2.45 | 2.45 |
| Accounts Payable | 2,333.6 | 2,123.0 | 1,285.5 | 2,055.9 | 2,050.0 | 765.4 | 593.3 | 459.9 | 356.5 | 276.4 |
| Accounts Payable, % | 41.21 | 41.03 | 59.06 | 81.37 | 133.98 | 64.53 | 64.53 | 64.53 | 64.53 | 64.53 |
| Capital Expenditure | -96.3 | -238.0 | -76.7 | -10.8 | -22.2 | -27.8 | -21.5 | -16.7 | -12.9 | -10.0 |
| Capital Expenditure, % | -1.7 | -4.6 | -3.52 | -0.42761 | -1.45 | -2.34 | -2.34 | -2.34 | -2.34 | -2.34 |
| Tax Rate, % | 8.31 | 8.31 | 8.31 | 8.31 | 8.31 | 8.31 | 8.31 | 8.31 | 8.31 | 8.31 |
| EBITAT | 341.5 | -173.1 | -573.5 | -647.9 | -1,265.6 | -312.5 | -242.3 | -187.8 | -145.6 | -112.8 |
| Depreciation | ||||||||||
| Changes in Account Receivables | ||||||||||
| Changes in Inventories | ||||||||||
| Changes in Accounts Payable | ||||||||||
| Capital Expenditure | ||||||||||
| UFCF | -3,933.4 | -235.8 | -235.9 | 662.4 | 544.5 | 614.7 | -105.3 | -81.6 | -63.3 | -49.0 |
| WACC, % | 5.1 | 5.03 | 5.01 | 4.95 | 5.08 | 5.04 | 5.04 | 5.04 | 5.04 | 5.04 |
| PV UFCF | ||||||||||
| SUM PV UFCF | 329.0 | |||||||||
| Long Term Growth Rate, % | 2.00 | |||||||||
| Free cash flow (T + 1) | -50 | |||||||||
| Terminal Value | -1,648 | |||||||||
| Present Terminal Value | -1,289 | |||||||||
| Enterprise Value | -960 | |||||||||
| Net Debt | 1,242 | |||||||||
| Equity Value | -2,202 | |||||||||
| Diluted Shares Outstanding, MM | 1,798 | |||||||||
| Equity Value Per Share | -1.22 |
Benefits You Will Receive
- Actual CZG Financials: Featuring both historical and projected data for precise valuation.
- Customizable Inputs: Adjust WACC, tax rates, revenue growth, and capital investments as needed.
- Real-Time Calculations: Dynamic computation of intrinsic value and NPV.
- Scenario Exploration: Evaluate multiple scenarios to assess the future performance of China Zhonghua Geotechnical Engineering Group Co., Ltd. (002542SZ).
- User-Friendly Interface: Designed for industry experts while remaining accessible to novices.
Key Features
- Comprehensive DCF Calculator: Features intricate unlevered and levered DCF valuation models tailored for China Zhonghua Geotechnical Engineering Group Co., Ltd. (002542SZ).
- WACC Evaluation Tool: A pre-configured Weighted Average Cost of Capital spreadsheet with adjustable parameters.
- Customizable Forecast Assumptions: Easily alter growth rates, capital expenditures, and discount rates to fit your analysis.
- Integrated Financial Ratios: Assess profitability, leverage, and operational efficiency ratios specific to China Zhonghua Geotechnical Engineering Group Co., Ltd. (002542SZ).
- Visual Dashboard and Charts: Graphical representations showcase essential valuation metrics for straightforward interpretation.
How It Works
- Step 1: Download the prebuilt Excel template that includes data for China Zhonghua Geotechnical Engineering Group Co., Ltd. (002542SZ).
- Step 2: Review the pre-filled sheets to familiarize yourself with the key metrics.
- Step 3: Modify forecasts and assumptions in the editable yellow cells (WACC, growth, margins).
- Step 4: Instantly see recalculated results, including the intrinsic value of China Zhonghua Geotechnical Engineering Group Co., Ltd. (002542SZ).
- Step 5: Use the results to make informed investment decisions or create comprehensive reports.
Why Opt for Our Services?
- Time Efficient: Skip the hassle of starting from scratch – our solutions are ready for immediate use.
- Enhanced Accuracy: Dependable data and methodologies minimize valuation discrepancies.
- Completely Customizable: Adjust our models to align with your specific assumptions and forecasts.
- User-Friendly: Intuitive charts and outputs simplify result interpretation.
- Endorsed by Professionals: Crafted for experts who prioritize both accuracy and functionality.
Who Can Benefit from This Product?
- Geotechnical Engineering Students: Master foundational concepts and apply them to real-world data.
- Researchers: Integrate advanced engineering models into academic projects or studies.
- Investors: Evaluate your investment hypotheses and observe valuation trends for China Zhonghua Geotechnical Engineering Group Co., Ltd. (002542SZ).
- Industry Analysts: Enhance your analysis efficiency with a customizable model specifically for geotechnical assessments.
- Infrastructure Developers: Understand the evaluation of major engineering firms like China Zhonghua Geotechnical Engineering Group Co., Ltd. (002542SZ).
Contents of the Template
- Operating and Balance Sheet Data: Comprehensive historical data and forecasts for China Zhonghua Geotechnical Engineering Group Co., Ltd. (002542SZ), including figures for revenue, EBITDA, EBIT, and capital expenditures.
- WACC Calculation: A dedicated sheet for calculating the Weighted Average Cost of Capital (WACC), featuring essential parameters such as Beta, risk-free rate, and share price.
- DCF Valuation (Unlevered and Levered): Customizable Discounted Cash Flow models that display intrinsic value along with thorough calculations.
- Financial Statements: Pre-loaded annual and quarterly financial statements to facilitate detailed analysis.
- Key Ratios: Profitability, leverage, and efficiency ratios specific to China Zhonghua Geotechnical Engineering Group Co., Ltd. (002542SZ).
- Dashboard and Charts: A visual representation of valuation outputs and assumptions for easy analysis of results.
Disclaimer
All information, articles, and product details provided on this website are for general informational and educational purposes only. We do not claim any ownership over, nor do we intend to infringe upon, any trademarks, copyrights, logos, brand names, or other intellectual property mentioned or depicted on this site. Such intellectual property remains the property of its respective owners, and any references here are made solely for identification or informational purposes, without implying any affiliation, endorsement, or partnership.
We make no representations or warranties, express or implied, regarding the accuracy, completeness, or suitability of any content or products presented. Nothing on this website should be construed as legal, tax, investment, financial, medical, or other professional advice. In addition, no part of this site—including articles or product references—constitutes a solicitation, recommendation, endorsement, advertisement, or offer to buy or sell any securities, franchises, or other financial instruments, particularly in jurisdictions where such activity would be unlawful.
All content is of a general nature and may not address the specific circumstances of any individual or entity. It is not a substitute for professional advice or services. Any actions you take based on the information provided here are strictly at your own risk. You accept full responsibility for any decisions or outcomes arising from your use of this website and agree to release us from any liability in connection with your use of, or reliance upon, the content or products found herein.