
|
Anhui Huilong Agricultural Means de Production Co., Ltd. (002556.sz) Avaliação DCF |
Totalmente Editável: Adapte-Se Às Suas Necessidades No Excel Ou Planilhas
Design Profissional: Modelos Confiáveis E Padrão Da Indústria
Pré-Construídos Para Uso Rápido E Eficiente
Compatível com MAC/PC, totalmente desbloqueado
Não É Necessária Experiência; Fácil De Seguir
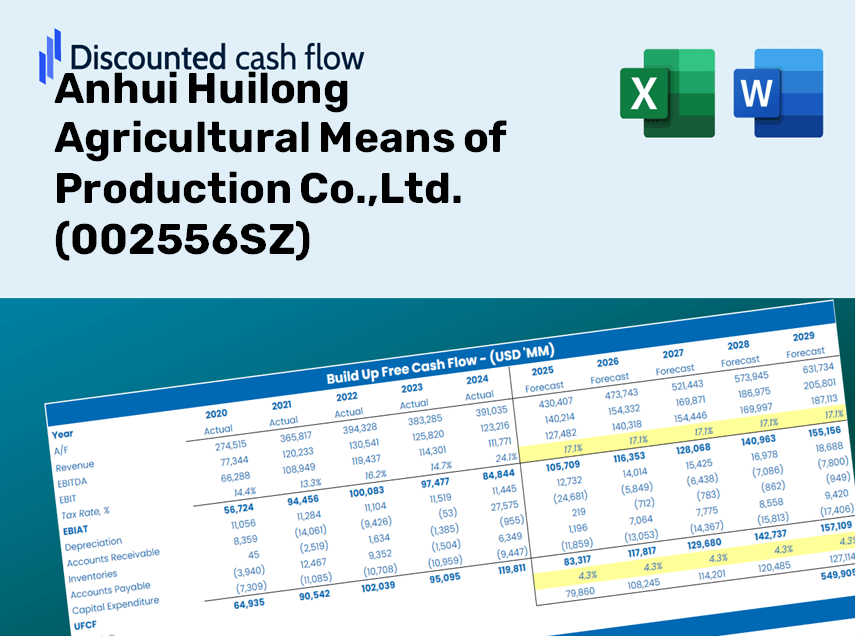
Anhui Huilong Agricultural Means of Production Co.,Ltd. (002556.SZ) Bundle
Projetado para precisão, a nossa calculadora DCF (002556SZ) permite avaliar meios de produção agrícola de Anhui Huilong de Produção Co., Ltd. usando dados financeiros atualizados, permitindo flexibilidade completa para modificar todos os parâmetros essenciais para projeções aprimoradas.
Discounted Cash Flow (DCF) - (USD MM)
| Year | AY1 2020 |
AY2 2021 |
AY3 2022 |
AY4 2023 |
AY5 2024 |
FY1 2025 |
FY2 2026 |
FY3 2027 |
FY4 2028 |
FY5 2029 |
|---|---|---|---|---|---|---|---|---|---|---|
| Revenue | 16,102.5 | 19,081.3 | 18,249.3 | 17,832.7 | 15,652.1 | 15,637.6 | 15,623.0 | 15,608.5 | 15,594.0 | 15,579.5 |
| Revenue Growth, % | 0 | 18.5 | -4.36 | -2.28 | -12.23 | -0.092987 | -0.092987 | -0.092987 | -0.092987 | -0.092987 |
| EBITDA | 520.0 | 846.7 | 931.3 | 470.5 | 610.1 | 603.8 | 603.2 | 602.7 | 602.1 | 601.6 |
| EBITDA, % | 3.23 | 4.44 | 5.1 | 2.64 | 3.9 | 3.86 | 3.86 | 3.86 | 3.86 | 3.86 |
| Depreciation | 156.6 | 202.8 | 253.8 | 295.3 | 303.0 | 219.5 | 219.3 | 219.1 | 218.9 | 218.7 |
| Depreciation, % | 0.97269 | 1.06 | 1.39 | 1.66 | 1.94 | 1.4 | 1.4 | 1.4 | 1.4 | 1.4 |
| EBIT | 363.4 | 643.9 | 677.4 | 175.1 | 307.2 | 384.3 | 383.9 | 383.6 | 383.2 | 382.9 |
| EBIT, % | 2.26 | 3.37 | 3.71 | 0.98209 | 1.96 | 2.46 | 2.46 | 2.46 | 2.46 | 2.46 |
| Total Cash | 2,018.7 | 1,673.2 | 1,477.3 | 1,812.3 | 980.9 | 1,433.4 | 1,432.0 | 1,430.7 | 1,429.4 | 1,428.0 |
| Total Cash, percent | .0 | .0 | .0 | .0 | .0 | .0 | .0 | .0 | .0 | .0 |
| Account Receivables | 627.9 | 705.9 | 650.1 | 790.7 | 621.5 | 611.9 | 611.4 | 610.8 | 610.2 | 609.7 |
| Account Receivables, % | 3.9 | 3.7 | 3.56 | 4.43 | 3.97 | 3.91 | 3.91 | 3.91 | 3.91 | 3.91 |
| Inventories | 1,699.2 | 2,366.7 | 2,412.3 | 2,583.8 | 2,999.8 | 2,183.9 | 2,181.9 | 2,179.9 | 2,177.8 | 2,175.8 |
| Inventories, % | 10.55 | 12.4 | 13.22 | 14.49 | 19.17 | 13.97 | 13.97 | 13.97 | 13.97 | 13.97 |
| Accounts Payable | 1,455.8 | 2,643.2 | 3,373.8 | 3,044.6 | 2,603.1 | 2,348.3 | 2,346.1 | 2,343.9 | 2,341.7 | 2,339.6 |
| Accounts Payable, % | 9.04 | 13.85 | 18.49 | 17.07 | 16.63 | 15.02 | 15.02 | 15.02 | 15.02 | 15.02 |
| Capital Expenditure | -373.0 | -745.5 | -274.5 | -556.7 | -261.4 | -391.6 | -391.2 | -390.8 | -390.5 | -390.1 |
| Capital Expenditure, % | -2.32 | -3.91 | -1.5 | -3.12 | -1.67 | -2.5 | -2.5 | -2.5 | -2.5 | -2.5 |
| Tax Rate, % | 18.25 | 18.25 | 18.25 | 18.25 | 18.25 | 18.25 | 18.25 | 18.25 | 18.25 | 18.25 |
| EBITAT | 310.7 | 535.6 | 559.7 | 111.8 | 251.1 | 305.1 | 304.8 | 304.5 | 304.2 | 303.9 |
| Depreciation | ||||||||||
| Changes in Account Receivables | ||||||||||
| Changes in Inventories | ||||||||||
| Changes in Accounts Payable | ||||||||||
| Capital Expenditure | ||||||||||
| UFCF | -776.9 | 434.8 | 1,279.9 | -790.9 | -395.7 | 703.7 | 133.3 | 133.2 | 133.0 | 132.9 |
| WACC, % | 5.34 | 5.31 | 5.3 | 5.05 | 5.29 | 5.25 | 5.25 | 5.25 | 5.25 | 5.25 |
| PV UFCF | ||||||||||
| SUM PV UFCF | 1,114.4 | |||||||||
| Long Term Growth Rate, % | 3.50 | |||||||||
| Free cash flow (T + 1) | 138 | |||||||||
| Terminal Value | 7,841 | |||||||||
| Present Terminal Value | 6,069 | |||||||||
| Enterprise Value | 7,184 | |||||||||
| Net Debt | 1,688 | |||||||||
| Equity Value | 5,496 | |||||||||
| Diluted Shares Outstanding, MM | 938 | |||||||||
| Equity Value Per Share | 5.86 |
Benefits You Will Receive
- Flexible Forecasting Inputs: Quickly modify key assumptions (growth %, margins, WACC) to explore various scenarios.
- Comprehensive Market Data: Pre-loaded financial information for Anhui Huilong Agricultural Means of Production Co., Ltd. ([002556SZ]) to streamline your analysis.
- Automated DCF Calculations: The template provides Net Present Value (NPV) and intrinsic value calculations effortlessly.
- Tailored and Professional Design: A refined Excel model that meets your specific valuation requirements.
- Designed for Analysts and Investors: Perfect for evaluating projections, confirming strategies, and enhancing efficiency.
Key Features
- 🔍 Real-Life (002556SZ) Financials: Pre-filled historical and projected data for Anhui Huilong Agricultural Means of Production Co., Ltd.
- ✏️ Fully Customizable Inputs: Modify all essential parameters (yellow cells) such as WACC, growth %, and tax rates.
- 📊 Professional DCF Valuation: Integrated formulas calculate the intrinsic value of Anhui Huilong using the Discounted Cash Flow method.
- ⚡ Instant Results: View Anhui Huilong’s valuation immediately after making adjustments.
- Scenario Analysis: Evaluate and compare outcomes for different financial assumptions side-by-side.
How It Works
- Download: Get the pre-configured Excel file containing Anhui Huilong Agricultural Means of Production Co., Ltd.'s (002556SZ) financial data.
- Customize: Tailor your forecasts by modifying parameters such as revenue growth, EBITDA %, and WACC.
- Update Automatically: Enjoy real-time updates for intrinsic value and NPV calculations.
- Test Scenarios: Generate various projections and swiftly compare results.
- Make Decisions: Leverage the valuation insights to inform your investment approach.
Why Choose This Calculator for Anhui Huilong Agricultural Means of Production Co., Ltd. (002556SZ)?
- All-in-One Solution: Combines DCF, WACC, and financial ratio analyses for a comprehensive evaluation.
- Flexible Inputs: Modify the yellow-highlighted fields to explore different financial scenarios.
- In-Depth Analysis: Automatically computes Anhui Huilong’s intrinsic value and Net Present Value.
- Data Ready to Use: Features both historical and projected data for precise assessments.
- High-Quality Standards: Perfect for financial analysts, investors, and business consultants.
Who Can Benefit from This Product?
- Investors: Assess the valuation of Anhui Huilong Agricultural Means of Production Co., Ltd. (002556SZ) before making investment decisions.
- CFOs and Financial Analysts: Enhance valuation methodologies and evaluate financial projections.
- Startup Founders: Understand how leading agricultural companies like Anhui Huilong are appraised.
- Consultants: Provide comprehensive valuation analyses and reports for your clients.
- Students and Educators: Utilize current data to practice and instruct on valuation strategies.
Contents of the Template
- Pre-Filled DCF Model: Anhui Huilong Agricultural Means of Production Co.,Ltd.'s financial data preloaded for immediate analysis.
- WACC Calculator: Comprehensive calculations for Weighted Average Cost of Capital.
- Financial Ratios: Assess Anhui Huilong's profitability, leverage, and operational efficiency.
- Editable Inputs: Adjust assumptions such as growth rates, profit margins, and CAPEX to align with your scenarios.
- Financial Statements: Access annual and quarterly reports for thorough investigation.
- Interactive Dashboard: Effortlessly visualize essential valuation metrics and outcomes.
Disclaimer
All information, articles, and product details provided on this website are for general informational and educational purposes only. We do not claim any ownership over, nor do we intend to infringe upon, any trademarks, copyrights, logos, brand names, or other intellectual property mentioned or depicted on this site. Such intellectual property remains the property of its respective owners, and any references here are made solely for identification or informational purposes, without implying any affiliation, endorsement, or partnership.
We make no representations or warranties, express or implied, regarding the accuracy, completeness, or suitability of any content or products presented. Nothing on this website should be construed as legal, tax, investment, financial, medical, or other professional advice. In addition, no part of this site—including articles or product references—constitutes a solicitation, recommendation, endorsement, advertisement, or offer to buy or sell any securities, franchises, or other financial instruments, particularly in jurisdictions where such activity would be unlawful.
All content is of a general nature and may not address the specific circumstances of any individual or entity. It is not a substitute for professional advice or services. Any actions you take based on the information provided here are strictly at your own risk. You accept full responsibility for any decisions or outcomes arising from your use of this website and agree to release us from any liability in connection with your use of, or reliance upon, the content or products found herein.