
|
Giant Network Group Co., Ltd. (002558.sz) Avaliação DCF |
Totalmente Editável: Adapte-Se Às Suas Necessidades No Excel Ou Planilhas
Design Profissional: Modelos Confiáveis E Padrão Da Indústria
Pré-Construídos Para Uso Rápido E Eficiente
Compatível com MAC/PC, totalmente desbloqueado
Não É Necessária Experiência; Fácil De Seguir
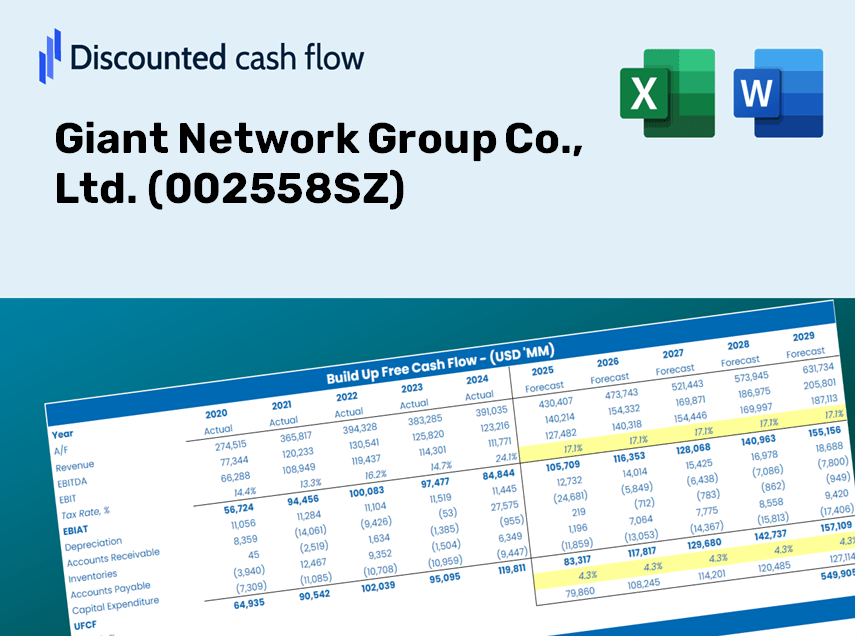
Giant Network Group Co., Ltd. (002558.SZ) Bundle
Otimize seu tempo e melhore a precisão com a calculadora DCF [002558SZ]! Utilizando dados reais da Giant Network Group Co., Ltd. e suposições personalizáveis, essa ferramenta permite que você preveja, analise e valorize rede gigante como um investidor experiente.
Discounted Cash Flow (DCF) - (USD MM)
| Year | AY1 2020 |
AY2 2021 |
AY3 2022 |
AY4 2023 |
AY5 2024 |
FY1 2025 |
FY2 2026 |
FY3 2027 |
FY4 2028 |
FY5 2029 |
|---|---|---|---|---|---|---|---|---|---|---|
| Revenue | 2,217.3 | 2,124.3 | 2,037.7 | 2,924.2 | 2,922.8 | 3,180.0 | 3,459.7 | 3,764.0 | 4,095.2 | 4,455.4 |
| Revenue Growth, % | 0 | -4.2 | -4.07 | 43.5 | -0.04538961 | 8.8 | 8.8 | 8.8 | 8.8 | 8.8 |
| EBITDA | 702.8 | 599.0 | 634.5 | 862.9 | 797.4 | 940.2 | 1,022.9 | 1,112.8 | 1,210.7 | 1,317.2 |
| EBITDA, % | 31.7 | 28.2 | 31.14 | 29.51 | 27.28 | 29.56 | 29.56 | 29.56 | 29.56 | 29.56 |
| Depreciation | 95.1 | 85.6 | 56.9 | 45.6 | 37.9 | 88.9 | 96.7 | 105.2 | 114.4 | 124.5 |
| Depreciation, % | 4.29 | 4.03 | 2.79 | 1.56 | 1.3 | 2.79 | 2.79 | 2.79 | 2.79 | 2.79 |
| EBIT | 607.8 | 513.4 | 577.6 | 817.2 | 759.5 | 851.3 | 926.2 | 1,007.7 | 1,096.3 | 1,192.7 |
| EBIT, % | 27.41 | 24.17 | 28.35 | 27.95 | 25.99 | 26.77 | 26.77 | 26.77 | 26.77 | 26.77 |
| Total Cash | 3,493.9 | 3,126.4 | 2,122.2 | 2,103.1 | 2,273.6 | 2,860.1 | 3,111.7 | 3,385.4 | 3,683.3 | 4,007.3 |
| Total Cash, percent | .0 | .0 | .0 | .0 | .0 | .0 | .0 | .0 | .0 | .0 |
| Account Receivables | 521.9 | 198.1 | 136.4 | 167.9 | 159.4 | 322.8 | 351.2 | 382.1 | 415.7 | 452.3 |
| Account Receivables, % | 23.54 | 9.33 | 6.69 | 5.74 | 5.45 | 10.15 | 10.15 | 10.15 | 10.15 | 10.15 |
| Inventories | -412.7 | -672.4 | -384.6 | -2.4 | .0 | -440.3 | -479.0 | -521.1 | -567.0 | -616.8 |
| Inventories, % | -18.61 | -31.65 | -18.88 | -0.0822774 | 0 | -13.84 | -13.84 | -13.84 | -13.84 | -13.84 |
| Accounts Payable | 41.4 | 42.0 | 51.6 | 52.2 | 53.2 | 63.5 | 69.1 | 75.1 | 81.8 | 88.9 |
| Accounts Payable, % | 1.87 | 1.98 | 2.53 | 1.79 | 1.82 | 2 | 2 | 2 | 2 | 2 |
| Capital Expenditure | -86.7 | -210.3 | -113.4 | -88.6 | -187.4 | -183.3 | -199.4 | -216.9 | -236.0 | -256.8 |
| Capital Expenditure, % | -3.91 | -9.9 | -5.56 | -3.03 | -6.41 | -5.76 | -5.76 | -5.76 | -5.76 | -5.76 |
| Tax Rate, % | 1.55 | 1.55 | 1.55 | 1.55 | 1.55 | 1.55 | 1.55 | 1.55 | 1.55 | 1.55 |
| EBITAT | 574.5 | 496.0 | 592.4 | 806.1 | 747.7 | 831.3 | 904.4 | 984.0 | 1,070.5 | 1,164.7 |
| Depreciation | ||||||||||
| Changes in Account Receivables | ||||||||||
| Changes in Inventories | ||||||||||
| Changes in Accounts Payable | ||||||||||
| Capital Expenditure | ||||||||||
| UFCF | 515.1 | 955.5 | 319.4 | 350.0 | 605.3 | 1,024.0 | 817.6 | 889.5 | 967.8 | 1,052.9 |
| WACC, % | 8.39 | 8.39 | 8.39 | 8.39 | 8.39 | 8.39 | 8.39 | 8.39 | 8.39 | 8.39 |
| PV UFCF | ||||||||||
| SUM PV UFCF | 3,744.0 | |||||||||
| Long Term Growth Rate, % | 3.50 | |||||||||
| Free cash flow (T + 1) | 1,090 | |||||||||
| Terminal Value | 22,278 | |||||||||
| Present Terminal Value | 14,890 | |||||||||
| Enterprise Value | 18,634 | |||||||||
| Net Debt | -1,387 | |||||||||
| Equity Value | 20,021 | |||||||||
| Diluted Shares Outstanding, MM | 1,827 | |||||||||
| Equity Value Per Share | 10.96 |
What You Will Receive
- Genuine 002558SZ Financial Data: Pre-filled with Giant Network Group’s historical and projected data for accurate analysis.
- Completely Customizable Template: Easily adjust key inputs such as revenue growth, WACC, and EBITDA %.
- Instant Calculations: Watch the intrinsic value of Giant Network Group update in real-time based on your inputs.
- Professional Valuation Solution: Crafted for investors, analysts, and consultants aiming for precise DCF outcomes.
- User-Friendly Interface: Straightforward layout and clear guidelines suitable for all experience levels.
Key Features
- Comprehensive DCF Calculator: Offers detailed unlevered and levered DCF valuation models specifically designed for Giant Network Group Co., Ltd. (002558SZ).
- WACC Calculator: A pre-built Weighted Average Cost of Capital template with customizable inputs tailored for [Symbol].
- Customizable Forecast Assumptions: Adjust variables such as growth rates, capital expenditures, and discount rates to fit your analysis.
- Integrated Financial Ratios: Evaluate profitability, leverage, and efficiency ratios for Giant Network Group Co., Ltd. (002558SZ).
- Interactive Dashboard and Charts: Visual representations that summarize essential valuation metrics for straightforward analysis.
How It Operates
- Step 1: Download the prebuilt Excel template containing Giant Network Group Co., Ltd.'s (002558SZ) data.
- Step 2: Review the pre-filled sheets to familiarize yourself with the essential metrics.
- Step 3: Modify forecasts and assumptions in the editable yellow cells (WACC, growth, margins).
- Step 4: Immediately see the recalculated results, including the intrinsic value of Giant Network Group Co., Ltd. (002558SZ).
- Step 5: Utilize the outputs to make well-informed investment decisions or create reports.
Why Choose This Calculator for Giant Network Group Co., Ltd. (002558SZ)?
- Precise Financial Insights: Utilize accurate data from Giant Network Group Co., Ltd. for dependable valuation outcomes.
- Tailorable Features: Modify essential parameters such as growth rates, WACC, and tax rates to align with your specific forecasts.
- Efficiency Boost: Built-in calculations save you time by removing the need to create models from the ground up.
- Professional Quality: Developed for use by investors, analysts, and consultants seeking in-depth analysis.
- Easy to Navigate: The intuitive design and step-by-step guidance ensure accessibility for all users.
Who Can Benefit from This Product?
- Investors: Assess the valuation of Giant Network Group Co., Ltd. (002558SZ) prior to executing buy or sell trades.
- CFOs and Financial Analysts: Optimize valuation workflows and evaluate financial forecasts.
- Startup Founders: Gain insights into the valuation methods used for publicly traded companies like Giant Network Group Co., Ltd. (002558SZ).
- Consultants: Provide comprehensive valuation reports to your clients.
- Students and Educators: Utilize authentic data to explore and instruct on valuation practices.
What the Template Contains
- Historical Data: Includes Giant Network Group's (002558SZ) previous financial performance and baseline projections.
- DCF and Levered DCF Models: Comprehensive templates to assess the intrinsic value of Giant Network Group (002558SZ).
- WACC Sheet: Ready-to-use calculations for the Weighted Average Cost of Capital.
- Editable Inputs: Adjust key assumptions such as growth rates, EBITDA percentages, and CAPEX estimates.
- Quarterly and Annual Statements: A detailed analysis of Giant Network Group's (002558SZ) financial statements.
- Interactive Dashboard: Dynamically visualize valuation outcomes and future projections.
Disclaimer
All information, articles, and product details provided on this website are for general informational and educational purposes only. We do not claim any ownership over, nor do we intend to infringe upon, any trademarks, copyrights, logos, brand names, or other intellectual property mentioned or depicted on this site. Such intellectual property remains the property of its respective owners, and any references here are made solely for identification or informational purposes, without implying any affiliation, endorsement, or partnership.
We make no representations or warranties, express or implied, regarding the accuracy, completeness, or suitability of any content or products presented. Nothing on this website should be construed as legal, tax, investment, financial, medical, or other professional advice. In addition, no part of this site—including articles or product references—constitutes a solicitation, recommendation, endorsement, advertisement, or offer to buy or sell any securities, franchises, or other financial instruments, particularly in jurisdictions where such activity would be unlawful.
All content is of a general nature and may not address the specific circumstances of any individual or entity. It is not a substitute for professional advice or services. Any actions you take based on the information provided here are strictly at your own risk. You accept full responsibility for any decisions or outcomes arising from your use of this website and agree to release us from any liability in connection with your use of, or reliance upon, the content or products found herein.