
|
Zhejiang Vie Science & Technology Co., Ltd. (002590.sz) Avaliação DCF |
Totalmente Editável: Adapte-Se Às Suas Necessidades No Excel Ou Planilhas
Design Profissional: Modelos Confiáveis E Padrão Da Indústria
Pré-Construídos Para Uso Rápido E Eficiente
Compatível com MAC/PC, totalmente desbloqueado
Não É Necessária Experiência; Fácil De Seguir
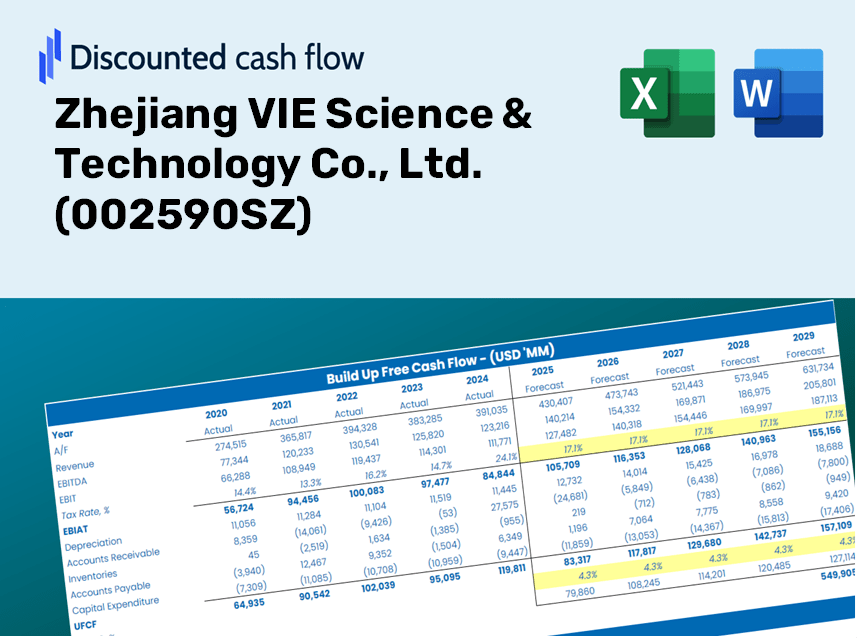
Zhejiang VIE Science & Technology Co., Ltd. (002590.SZ) Bundle
Aprimore suas opções de investimento com a calculadora DCF (002590SZ)! Explore dados financeiros autênticos para Zhejiang Vie Science & Technology Co., Ltd., Ajuste as projeções e despesas de crescimento e observe instantaneamente como essas alterações afetam o valor intrínseco da empresa.
Discounted Cash Flow (DCF) - (USD MM)
| Year | AY1 2020 |
AY2 2021 |
AY3 2022 |
AY4 2023 |
AY5 2024 |
FY1 2025 |
FY2 2026 |
FY3 2027 |
FY4 2028 |
FY5 2029 |
|---|---|---|---|---|---|---|---|---|---|---|
| Revenue | 2,522.0 | 2,713.1 | 3,364.1 | 3,982.5 | 4,335.9 | 4,973.5 | 5,705.0 | 6,543.9 | 7,506.3 | 8,610.2 |
| Revenue Growth, % | 0 | 7.58 | 23.99 | 18.38 | 8.87 | 14.71 | 14.71 | 14.71 | 14.71 | 14.71 |
| EBITDA | 227.7 | 131.5 | 137.1 | 297.5 | 395.2 | 343.5 | 394.1 | 452.0 | 518.5 | 594.7 |
| EBITDA, % | 9.03 | 4.85 | 4.08 | 7.47 | 9.11 | 6.91 | 6.91 | 6.91 | 6.91 | 6.91 |
| Depreciation | 135.3 | 133.4 | 135.3 | 164.5 | 181.0 | 224.9 | 257.9 | 295.9 | 339.4 | 389.3 |
| Depreciation, % | 5.36 | 4.92 | 4.02 | 4.13 | 4.17 | 4.52 | 4.52 | 4.52 | 4.52 | 4.52 |
| EBIT | 92.4 | -1.9 | 1.8 | 133.1 | 214.2 | 118.7 | 136.1 | 156.2 | 179.1 | 205.5 |
| EBIT, % | 3.67 | -0.07010823 | 0.05433479 | 3.34 | 4.94 | 2.39 | 2.39 | 2.39 | 2.39 | 2.39 |
| Total Cash | 610.8 | 596.4 | 857.7 | 878.6 | 1,111.3 | 1,187.6 | 1,362.2 | 1,562.5 | 1,792.3 | 2,055.9 |
| Total Cash, percent | .0 | .0 | .0 | .0 | .0 | .0 | .0 | .0 | .0 | .0 |
| Account Receivables | 1,180.3 | 1,167.7 | 1,362.4 | 1,757.9 | 1,966.4 | 2,186.7 | 2,508.2 | 2,877.1 | 3,300.2 | 3,785.6 |
| Account Receivables, % | 46.8 | 43.04 | 40.5 | 44.14 | 45.35 | 43.97 | 43.97 | 43.97 | 43.97 | 43.97 |
| Inventories | 507.0 | 670.9 | 696.1 | 690.0 | 703.2 | 985.4 | 1,130.3 | 1,296.6 | 1,487.3 | 1,706.0 |
| Inventories, % | 20.1 | 24.73 | 20.69 | 17.33 | 16.22 | 19.81 | 19.81 | 19.81 | 19.81 | 19.81 |
| Accounts Payable | 1,043.8 | 1,176.0 | 1,449.0 | 1,818.7 | 1,774.6 | 2,132.7 | 2,446.3 | 2,806.1 | 3,218.7 | 3,692.1 |
| Accounts Payable, % | 41.39 | 43.34 | 43.07 | 45.67 | 40.93 | 42.88 | 42.88 | 42.88 | 42.88 | 42.88 |
| Capital Expenditure | -70.8 | -102.3 | -212.6 | -186.8 | -241.6 | -230.4 | -264.2 | -303.1 | -347.7 | -398.8 |
| Capital Expenditure, % | -2.81 | -3.77 | -6.32 | -4.69 | -5.57 | -4.63 | -4.63 | -4.63 | -4.63 | -4.63 |
| Tax Rate, % | 8.12 | 8.12 | 8.12 | 8.12 | 8.12 | 8.12 | 8.12 | 8.12 | 8.12 | 8.12 |
| EBITAT | 68.2 | -5.3 | 2.0 | 129.9 | 196.8 | 109.9 | 126.1 | 144.7 | 165.9 | 190.3 |
| Depreciation | ||||||||||
| Changes in Account Receivables | ||||||||||
| Changes in Inventories | ||||||||||
| Changes in Accounts Payable | ||||||||||
| Capital Expenditure | ||||||||||
| UFCF | -510.8 | 6.7 | -22.2 | 87.7 | -129.6 | -39.9 | -33.1 | -37.9 | -43.5 | -49.9 |
| WACC, % | 5.59 | 5.67 | 5.67 | 5.67 | 5.65 | 5.65 | 5.65 | 5.65 | 5.65 | 5.65 |
| PV UFCF | ||||||||||
| SUM PV UFCF | -172.4 | |||||||||
| Long Term Growth Rate, % | 3.50 | |||||||||
| Free cash flow (T + 1) | -52 | |||||||||
| Terminal Value | -2,401 | |||||||||
| Present Terminal Value | -1,824 | |||||||||
| Enterprise Value | -1,996 | |||||||||
| Net Debt | -610 | |||||||||
| Equity Value | -1,386 | |||||||||
| Diluted Shares Outstanding, MM | 491 | |||||||||
| Equity Value Per Share | -2.82 |
Benefits You Will Receive
- Adjustable Forecast Variables: Effortlessly modify key inputs (growth %, margins, WACC) to explore various scenarios.
- Comprehensive Market Data: Financial data for Zhejiang VIE Science & Technology Co., Ltd. (002590SZ) is pre-loaded to facilitate your analysis.
- Automated DCF Calculations: The model computes Net Present Value (NPV) and intrinsic value automatically.
- Tailored and Professional Design: A sleek Excel model that aligns with your valuation requirements.
- Designed for Analysts and Investors: Perfect for assessing forecasts, verifying strategies, and streamlining your workflow.
Key Features
- Authentic Financial Data for Zhejiang VIE Science & Technology (002590SZ): Gain access to precise pre-loaded historical data and future forecasts.
- Personalized Forecast Assumptions: Modify yellow-highlighted cells for WACC, growth rates, and profit margins.
- Real-Time Calculations: Automatic updates for DCF, Net Present Value (NPV), and cash flow evaluations.
- Intuitive Visual Dashboard: Clear charts and summaries to help visualize your valuation outcomes.
- Designed for All Skill Levels: A user-friendly layout tailored for investors, CFOs, and consultants alike.
How It Works
- Step 1: Download the Excel file for Zhejiang VIE Science & Technology Co., Ltd. (002590SZ).
- Step 2: Examine the pre-filled financial data and forecasts provided for the company.
- Step 3: Adjust key inputs such as revenue growth, WACC, and tax rates (cells marked for easy identification).
- Step 4: Observe how the DCF model refreshes automatically as you modify your assumptions.
- Step 5: Evaluate the results and leverage them for informed investment decisions.
Why Opt for This Calculator?
- User-Friendly Interface: Perfectly suited for both novices and seasoned professionals.
- Customizable Parameters: Effortlessly adjust inputs to tailor your analysis.
- Real-Time Updates: Instantly witness changes to Zhejiang VIE Science & Technology Co., Ltd.'s (002590SZ) valuation as you modify inputs.
- Preloaded Data: Comes equipped with the latest financial information for quick assessments of Zhejiang VIE Science & Technology Co., Ltd. (002590SZ).
- Preferred by Experts: Utilized by investors and analysts for making informed investment decisions.
Who Can Benefit from This Product?
- Institutional Investors: Develop comprehensive and accurate valuation models for investment analysis in Zhejiang VIE Science & Technology Co., Ltd. (002590SZ).
- Corporate Finance Departments: Evaluate valuation scenarios to inform strategic decision-making within the organization.
- Consultants and Financial Advisors: Deliver precise valuation insights to clients regarding Zhejiang VIE Science & Technology Co., Ltd. (002590SZ).
- Students and Academic Professionals: Utilize real-world financial data to enhance learning and practice in financial modeling.
- Technology Investors: Gain insights into how technology firms like Zhejiang VIE Science & Technology Co., Ltd. (002590SZ) are appraised in the market.
Contents of the Template
- Pre-Filled Data: Contains Zhejiang VIE Science & Technology Co., Ltd.'s historical financials and projections.
- Discounted Cash Flow Model: An editable DCF valuation model featuring automatic calculations.
- Weighted Average Cost of Capital (WACC): A dedicated worksheet for calculating WACC using personalized inputs.
- Key Financial Ratios: Assess the profitability, efficiency, and leverage of Zhejiang VIE Science & Technology Co., Ltd.
- Customizable Inputs: Easily modify revenue growth, profit margins, and tax rates.
- Clear Dashboard: Charts and tables that provide a summary of key valuation outcomes.
Disclaimer
All information, articles, and product details provided on this website are for general informational and educational purposes only. We do not claim any ownership over, nor do we intend to infringe upon, any trademarks, copyrights, logos, brand names, or other intellectual property mentioned or depicted on this site. Such intellectual property remains the property of its respective owners, and any references here are made solely for identification or informational purposes, without implying any affiliation, endorsement, or partnership.
We make no representations or warranties, express or implied, regarding the accuracy, completeness, or suitability of any content or products presented. Nothing on this website should be construed as legal, tax, investment, financial, medical, or other professional advice. In addition, no part of this site—including articles or product references—constitutes a solicitation, recommendation, endorsement, advertisement, or offer to buy or sell any securities, franchises, or other financial instruments, particularly in jurisdictions where such activity would be unlawful.
All content is of a general nature and may not address the specific circumstances of any individual or entity. It is not a substitute for professional advice or services. Any actions you take based on the information provided here are strictly at your own risk. You accept full responsibility for any decisions or outcomes arising from your use of this website and agree to release us from any liability in connection with your use of, or reliance upon, the content or products found herein.