
|
Himile Mechanical Science and Technology Co., Ltd (002595.sz) Avaliação DCF |
Totalmente Editável: Adapte-Se Às Suas Necessidades No Excel Ou Planilhas
Design Profissional: Modelos Confiáveis E Padrão Da Indústria
Pré-Construídos Para Uso Rápido E Eficiente
Compatível com MAC/PC, totalmente desbloqueado
Não É Necessária Experiência; Fácil De Seguir
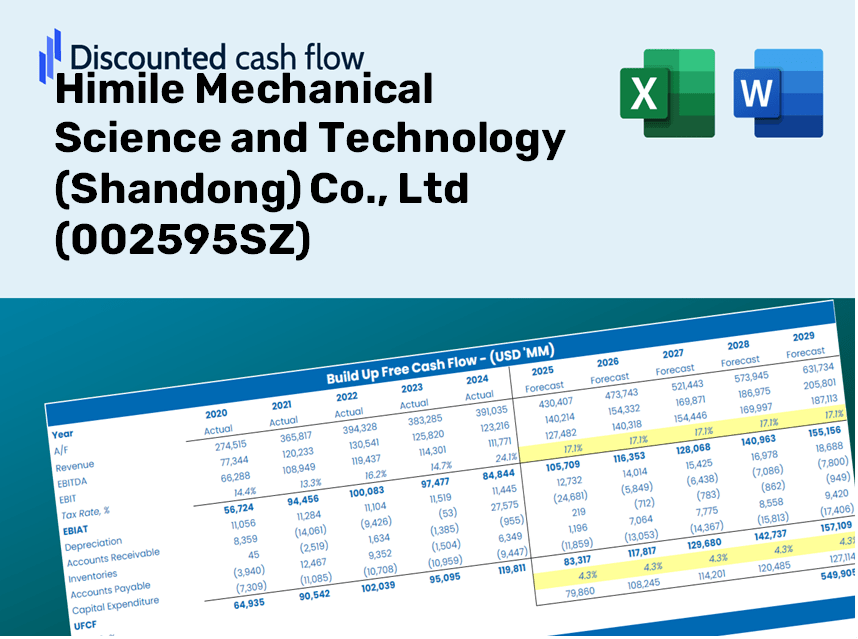
Himile Mechanical Science and Technology (Shandong) Co., Ltd (002595.SZ) Bundle
Avalie as perspectivas financeiras da Himile Mechanical Science and Technology (Shandong) Co., Ltd como um especialista! Esta calculadora DCF (002595SZ) vem com finanças pré-preenchidas e oferece total flexibilidade para modificar o crescimento da receita, o WACC, as margens e outras suposições cruciais para se alinhar com suas projeções.
Discounted Cash Flow (DCF) - (USD MM)
| Year | AY1 2020 |
AY2 2021 |
AY3 2022 |
AY4 2023 |
AY5 2024 |
FY1 2025 |
FY2 2026 |
FY3 2027 |
FY4 2028 |
FY5 2029 |
|---|---|---|---|---|---|---|---|---|---|---|
| Revenue | 5,294.5 | 6,008.3 | 6,642.2 | 7,165.8 | 8,813.4 | 10,023.2 | 11,399.1 | 12,963.8 | 14,743.3 | 16,767.1 |
| Revenue Growth, % | 0 | 13.48 | 10.55 | 7.88 | 22.99 | 13.73 | 13.73 | 13.73 | 13.73 | 13.73 |
| EBITDA | 1,407.8 | 1,426.1 | 1,547.0 | 2,082.6 | 2,464.9 | 2,619.0 | 2,978.5 | 3,387.3 | 3,852.3 | 4,381.1 |
| EBITDA, % | 26.59 | 23.74 | 23.29 | 29.06 | 27.97 | 26.13 | 26.13 | 26.13 | 26.13 | 26.13 |
| Depreciation | 239.2 | 259.9 | 288.2 | 307.9 | 328.1 | 425.0 | 483.4 | 549.7 | 625.2 | 711.0 |
| Depreciation, % | 4.52 | 4.33 | 4.34 | 4.3 | 3.72 | 4.24 | 4.24 | 4.24 | 4.24 | 4.24 |
| EBIT | 1,168.6 | 1,166.2 | 1,258.7 | 1,774.7 | 2,136.8 | 2,193.9 | 2,495.1 | 2,837.6 | 3,227.1 | 3,670.1 |
| EBIT, % | 22.07 | 19.41 | 18.95 | 24.77 | 24.24 | 21.89 | 21.89 | 21.89 | 21.89 | 21.89 |
| Total Cash | 293.5 | 410.5 | 621.8 | 1,761.0 | 1,500.7 | 1,269.7 | 1,444.0 | 1,642.2 | 1,867.6 | 2,124.0 |
| Total Cash, percent | .0 | .0 | .0 | .0 | .0 | .0 | .0 | .0 | .0 | .0 |
| Account Receivables | 2,363.7 | 2,837.0 | 2,763.8 | 2,859.8 | 3,379.7 | 4,244.4 | 4,827.0 | 5,489.6 | 6,243.1 | 7,100.1 |
| Account Receivables, % | 44.64 | 47.22 | 41.61 | 39.91 | 38.35 | 42.35 | 42.35 | 42.35 | 42.35 | 42.35 |
| Inventories | 943.3 | 1,450.2 | 1,623.0 | 1,672.4 | 2,478.5 | 2,362.4 | 2,686.7 | 3,055.5 | 3,475.0 | 3,952.0 |
| Inventories, % | 17.82 | 24.14 | 24.43 | 23.34 | 28.12 | 23.57 | 23.57 | 23.57 | 23.57 | 23.57 |
| Accounts Payable | 283.8 | 298.9 | 370.4 | 318.7 | 524.9 | 527.5 | 599.9 | 682.3 | 776.0 | 882.5 |
| Accounts Payable, % | 5.36 | 4.98 | 5.58 | 4.45 | 5.96 | 5.26 | 5.26 | 5.26 | 5.26 | 5.26 |
| Capital Expenditure | -214.9 | -210.0 | -368.7 | -302.3 | -372.2 | -431.9 | -491.2 | -558.6 | -635.3 | -722.5 |
| Capital Expenditure, % | -4.06 | -3.5 | -5.55 | -4.22 | -4.22 | -4.31 | -4.31 | -4.31 | -4.31 | -4.31 |
| Tax Rate, % | 12.28 | 12.28 | 12.28 | 12.28 | 12.28 | 12.28 | 12.28 | 12.28 | 12.28 | 12.28 |
| EBITAT | 1,005.6 | 1,026.4 | 1,116.6 | 1,551.3 | 1,874.5 | 1,921.5 | 2,185.3 | 2,485.2 | 2,826.4 | 3,214.3 |
| Depreciation | ||||||||||
| Changes in Account Receivables | ||||||||||
| Changes in Inventories | ||||||||||
| Changes in Accounts Payable | ||||||||||
| Capital Expenditure | ||||||||||
| UFCF | -1,993.2 | 111.2 | 1,008.0 | 1,359.7 | 710.7 | 1,168.6 | 1,342.9 | 1,527.3 | 1,736.9 | 1,975.4 |
| WACC, % | 5.68 | 5.68 | 5.68 | 5.68 | 5.68 | 5.68 | 5.68 | 5.68 | 5.68 | 5.68 |
| PV UFCF | ||||||||||
| SUM PV UFCF | 6,494.1 | |||||||||
| Long Term Growth Rate, % | 3.00 | |||||||||
| Free cash flow (T + 1) | 2,035 | |||||||||
| Terminal Value | 76,017 | |||||||||
| Present Terminal Value | 57,679 | |||||||||
| Enterprise Value | 64,173 | |||||||||
| Net Debt | -1,154 | |||||||||
| Equity Value | 65,327 | |||||||||
| Diluted Shares Outstanding, MM | 794 | |||||||||
| Equity Value Per Share | 82.29 |
Benefits You Will Receive
- Authentic Himile Mechanical Data: Pre-loaded with historical and projected financial information for detailed analysis.
- Completely Customizable Template: Easily adjust vital inputs such as sales growth, WACC, and EBITDA margins.
- Instant Calculations: Witness real-time updates of Himile's intrinsic value as you make adjustments.
- Expert Valuation Tool: Tailored for investors, analysts, and consultants aiming for precise DCF evaluations.
- Intuitive User Interface: Designed with a straightforward layout and easy-to-follow instructions suitable for all skill levels.
Key Features
- Comprehensive Financial Data: Gain access to reliable pre-loaded historical data and future forecasts for Himile Mechanical Science and Technology (Shandong) Co., Ltd (002595SZ).
- Personalized Forecast Assumptions: Modify highlighted fields such as WACC, growth rates, and margins to suit your analysis.
- Real-Time Calculations: Enjoy automatic refreshes for DCF, Net Present Value (NPV), and cash flow assessments.
- User-Friendly Dashboard: Intuitive charts and summaries to help you visualize valuation outcomes effortlessly.
- Suitable for All Levels: A straightforward layout designed for investors, CFOs, and consultants alike.
How It Works
- Step 1: Download the Excel file.
- Step 2: Review the pre-filled Himile Mechanical data (historical and projected).
- Step 3: Modify key assumptions (yellow cells) based on your analysis.
- Step 4: Observe automatic recalculations for Himile Mechanical’s intrinsic value.
- Step 5: Utilize the outputs for investment decisions or reporting.
Why Choose This Calculator for Himile Mechanical Science and Technology (Shandong) Co., Ltd (002595SZ)?
- Precise Financials: Utilize authentic financial data from Himile for trustworthy valuation outcomes.
- Fully Customizable: Tailor critical factors such as growth rates, WACC, and tax rates to suit your forecasts.
- Efficient: Pre-configured calculations save you the hassle of starting from square one.
- Advanced Tool: Crafted for investors, analysts, and consultants seeking depth and precision.
- Easy to Use: User-friendly design and comprehensive guidance ensure accessibility for all users.
Who Can Benefit from This Product?
- Investors: Evaluate the valuation of Himile Mechanical Science and Technology (Shandong) Co., Ltd (002595SZ) before making investment decisions.
- CFOs and Financial Analysts: Enhance valuation processes and assess fiscal forecasts.
- Startup Founders: Discover how established companies like Himile (002595SZ) are valued in the market.
- Consultants: Produce detailed valuation reports for client projects.
- Students and Educators: Utilize real-life data to practice and instruct on valuation methodologies.
Contents of the Template
- Preloaded Himile Data: Historical and projected financial metrics, including revenue, EBIT, and capital expenditures.
- DCF and WACC Models: Advanced spreadsheets for assessing intrinsic value and Weighted Average Cost of Capital.
- Editable Inputs: Yellow-highlighted cells for modifying revenue growth, tax rates, and discount rates.
- Financial Statements: Detailed annual and quarterly financial reports for in-depth analysis.
- Key Ratios: Important profitability, leverage, and efficiency ratios for performance evaluation.
- Dashboard and Charts: Visual representations of valuation results and underlying assumptions.
Disclaimer
All information, articles, and product details provided on this website are for general informational and educational purposes only. We do not claim any ownership over, nor do we intend to infringe upon, any trademarks, copyrights, logos, brand names, or other intellectual property mentioned or depicted on this site. Such intellectual property remains the property of its respective owners, and any references here are made solely for identification or informational purposes, without implying any affiliation, endorsement, or partnership.
We make no representations or warranties, express or implied, regarding the accuracy, completeness, or suitability of any content or products presented. Nothing on this website should be construed as legal, tax, investment, financial, medical, or other professional advice. In addition, no part of this site—including articles or product references—constitutes a solicitation, recommendation, endorsement, advertisement, or offer to buy or sell any securities, franchises, or other financial instruments, particularly in jurisdictions where such activity would be unlawful.
All content is of a general nature and may not address the specific circumstances of any individual or entity. It is not a substitute for professional advice or services. Any actions you take based on the information provided here are strictly at your own risk. You accept full responsibility for any decisions or outcomes arising from your use of this website and agree to release us from any liability in connection with your use of, or reliance upon, the content or products found herein.