
|
LB Group Co., Ltd. (002601.sz) Avaliação DCF |
Totalmente Editável: Adapte-Se Às Suas Necessidades No Excel Ou Planilhas
Design Profissional: Modelos Confiáveis E Padrão Da Indústria
Pré-Construídos Para Uso Rápido E Eficiente
Compatível com MAC/PC, totalmente desbloqueado
Não É Necessária Experiência; Fácil De Seguir
LB Group Co., Ltd. (002601.SZ) Bundle
Aprimore suas estratégias de investimento com a calculadora DCF do LB Group Co., Ltd. (002601SZ)! Explore os dados financeiros do grupo LB autênticos, ajustam as previsões e despesas de crescimento e observe instantaneamente como essas mudanças afetam o valor intrínseco do grupo LB.
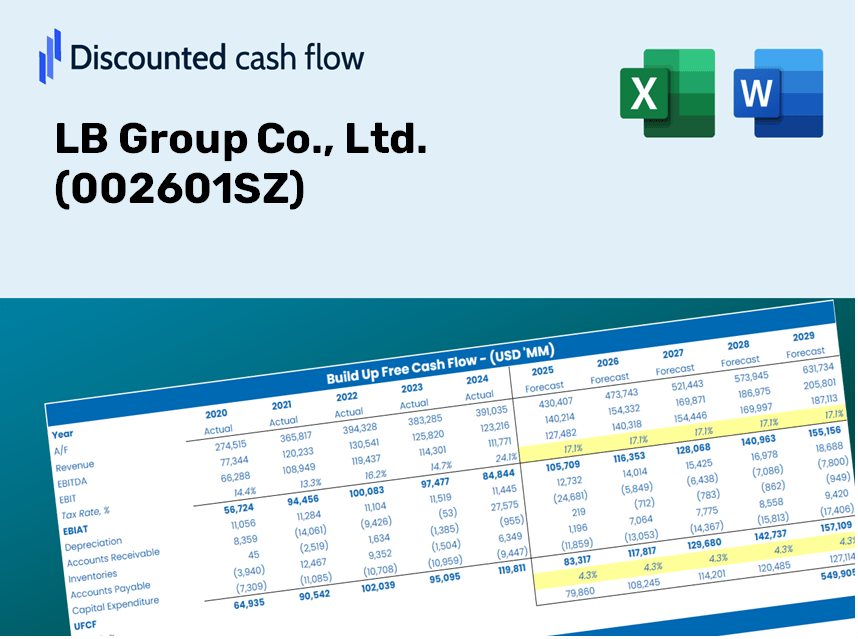
Discounted Cash Flow (DCF) - (USD MM)
| Year | AY1 2020 |
AY2 2021 |
AY3 2022 |
AY4 2023 |
AY5 2024 |
FY1 2025 |
FY2 2026 |
FY3 2027 |
FY4 2028 |
FY5 2029 |
|---|---|---|---|---|---|---|---|---|---|---|
| Revenue | 14,111.8 | 20,566.4 | 24,113.2 | 26,764.9 | 27,513.1 | 32,794.0 | 39,088.6 | 46,591.3 | 55,534.1 | 66,193.5 |
| Revenue Growth, % | 0 | 45.74 | 17.25 | 11 | 2.8 | 19.19 | 19.19 | 19.19 | 19.19 | 19.19 |
| EBITDA | 4,432.0 | 7,149.5 | 5,789.6 | 6,620.5 | 6,834.6 | 9,166.3 | 10,925.7 | 13,022.8 | 15,522.5 | 18,501.9 |
| EBITDA, % | 31.41 | 34.76 | 24.01 | 24.74 | 24.84 | 27.95 | 27.95 | 27.95 | 27.95 | 27.95 |
| Depreciation | 1,105.1 | 1,470.1 | 1,688.0 | 2,483.3 | 3,034.1 | 2,773.4 | 3,305.7 | 3,940.2 | 4,696.5 | 5,598.0 |
| Depreciation, % | 7.83 | 7.15 | 7 | 9.28 | 11.03 | 8.46 | 8.46 | 8.46 | 8.46 | 8.46 |
| EBIT | 3,326.9 | 5,679.4 | 4,101.6 | 4,137.2 | 3,800.5 | 6,392.9 | 7,620.0 | 9,082.6 | 10,825.9 | 12,903.9 |
| EBIT, % | 23.58 | 27.61 | 17.01 | 15.46 | 13.81 | 19.49 | 19.49 | 19.49 | 19.49 | 19.49 |
| Total Cash | 5,127.5 | 6,287.0 | 8,726.3 | 7,007.0 | 8,399.1 | 10,481.0 | 12,492.7 | 14,890.6 | 17,748.7 | 21,155.5 |
| Total Cash, percent | .0 | .0 | .0 | .0 | .0 | .0 | .0 | .0 | .0 | .0 |
| Account Receivables | 2,457.4 | 3,125.3 | 3,329.9 | 4,506.4 | 5,250.4 | 5,400.5 | 6,437.1 | 7,672.6 | 9,145.3 | 10,900.7 |
| Account Receivables, % | 17.41 | 15.2 | 13.81 | 16.84 | 19.08 | 16.47 | 16.47 | 16.47 | 16.47 | 16.47 |
| Inventories | 3,126.6 | 4,516.0 | 6,546.6 | 7,328.2 | 7,736.8 | 8,314.2 | 9,910.0 | 11,812.2 | 14,079.5 | 16,781.9 |
| Inventories, % | 22.16 | 21.96 | 27.15 | 27.38 | 28.12 | 25.35 | 25.35 | 25.35 | 25.35 | 25.35 |
| Accounts Payable | 7,729.7 | 10,086.5 | 15,029.7 | 10,278.8 | 12,211.4 | 16,327.3 | 19,461.1 | 23,196.6 | 27,648.9 | 32,955.9 |
| Accounts Payable, % | 54.77 | 49.04 | 62.33 | 38.4 | 44.38 | 49.79 | 49.79 | 49.79 | 49.79 | 49.79 |
| Capital Expenditure | -955.9 | -2,758.1 | -4,678.6 | -2,940.7 | -1,582.6 | -3,694.4 | -4,403.5 | -5,248.7 | -6,256.1 | -7,456.9 |
| Capital Expenditure, % | -6.77 | -13.41 | -19.4 | -10.99 | -5.75 | -11.27 | -11.27 | -11.27 | -11.27 | -11.27 |
| Tax Rate, % | 25.53 | 25.53 | 25.53 | 25.53 | 25.53 | 25.53 | 25.53 | 25.53 | 25.53 | 25.53 |
| EBITAT | 2,700.0 | 4,812.4 | 3,443.7 | 3,407.7 | 2,830.1 | 5,199.8 | 6,197.9 | 7,387.5 | 8,805.5 | 10,495.6 |
| Depreciation | ||||||||||
| Changes in Account Receivables | ||||||||||
| Changes in Inventories | ||||||||||
| Changes in Accounts Payable | ||||||||||
| Capital Expenditure | ||||||||||
| UFCF | 4,994.9 | 3,823.9 | 3,161.0 | -3,758.6 | 5,061.5 | 7,667.3 | 5,601.6 | 6,676.8 | 7,958.3 | 9,485.9 |
| WACC, % | 8.05 | 8.1 | 8.09 | 8.07 | 7.96 | 8.06 | 8.06 | 8.06 | 8.06 | 8.06 |
| PV UFCF | ||||||||||
| SUM PV UFCF | 29,461.1 | |||||||||
| Long Term Growth Rate, % | 3.00 | |||||||||
| Free cash flow (T + 1) | 9,770 | |||||||||
| Terminal Value | 193,210 | |||||||||
| Present Terminal Value | 131,150 | |||||||||
| Enterprise Value | 160,611 | |||||||||
| Net Debt | 10,190 | |||||||||
| Equity Value | 150,421 | |||||||||
| Diluted Shares Outstanding, MM | 2,383 | |||||||||
| Equity Value Per Share | 63.12 |
What You Will Receive
- Adjustable Forecast Inputs: Easily modify assumptions (growth %, profit margins, WACC) to explore various scenarios.
- Comprehensive Data: LB Group Co., Ltd. (002601SZ) financial data pre-loaded to accelerate your analysis.
- Instant DCF Outputs: The template automatically computes Net Present Value (NPV) and intrinsic value for your convenience.
- Sleek and Customizable: A sophisticated Excel model that conforms to your valuation requirements.
- Designed for Analysts and Investors: Perfect for evaluating projections, validating strategies, and enhancing efficiency.
Key Features
- Pre-Loaded Data: LB Group Co., Ltd.'s historical financial statements and pre-filled forecasts.
- Fully Adjustable Inputs: Customize WACC, tax rates, revenue growth, and EBITDA margins.
- Instant Results: View LB Group Co., Ltd.'s intrinsic value recalculating in real time.
- Clear Visual Outputs: Dashboard charts showcase valuation results and essential metrics.
- Built for Accuracy: A professional tool designed for analysts, investors, and finance professionals.
How It Works
- Step 1: Download the Excel file.
- Step 2: Review the pre-filled data for LB Group Co., Ltd. (002601SZ) (historical and projected).
- Step 3: Modify key assumptions (highlighted in yellow) based on your analysis.
- Step 4: Observe the automatic recalculations for LB Group Co., Ltd.'s intrinsic value.
- Step 5: Utilize the results for making investment decisions or for reporting purposes.
Reasons to Choose LB Group Co., Ltd. (002601SZ) Calculator
- Precise Data: Utilize the latest LB Group financials for trustworthy valuation outcomes.
- Flexible Options: Customize essential parameters such as growth rates, WACC, and tax rates to align with your forecasts.
- Efficient: Pre-configured calculations allow you to avoid starting from scratch.
- Professional-Quality Tool: Tailored for investors, analysts, and consultants.
- Easy to Use: User-friendly design and guided instructions make it accessible for everyone.
Who Can Benefit from LB Group Co., Ltd. (002601SZ)?
- Finance Students: Discover essential valuation methods and practice with actual market data.
- Academics: Integrate industry-standard models into your teaching materials or research projects.
- Investors: Evaluate your investment strategies and assess valuation results for LB Group Co., Ltd. (002601SZ).
- Analysts: Enhance your processes with a customizable and ready-to-use DCF model.
- Small Business Owners: Learn how major publicly traded firms like LB Group Co., Ltd. (002601SZ) are evaluated.
What the Template Includes
- Pre-Filled Data: Contains LB Group Co., Ltd.'s historical financial performance and projections.
- Discounted Cash Flow Model: User-friendly DCF valuation model with automatic computation features.
- Weighted Average Cost of Capital (WACC): A specific sheet to calculate WACC based on user-defined inputs.
- Key Financial Ratios: Evaluate LB Group Co., Ltd.'s profitability, operational efficiency, and financial leverage.
- Customizable Inputs: Easily modify revenue growth rates, profit margins, and tax percentages.
- Intuitive Dashboard: Visual representations, including charts and tables, summarizing essential valuation outcomes.
Disclaimer
All information, articles, and product details provided on this website are for general informational and educational purposes only. We do not claim any ownership over, nor do we intend to infringe upon, any trademarks, copyrights, logos, brand names, or other intellectual property mentioned or depicted on this site. Such intellectual property remains the property of its respective owners, and any references here are made solely for identification or informational purposes, without implying any affiliation, endorsement, or partnership.
We make no representations or warranties, express or implied, regarding the accuracy, completeness, or suitability of any content or products presented. Nothing on this website should be construed as legal, tax, investment, financial, medical, or other professional advice. In addition, no part of this site—including articles or product references—constitutes a solicitation, recommendation, endorsement, advertisement, or offer to buy or sell any securities, franchises, or other financial instruments, particularly in jurisdictions where such activity would be unlawful.
All content is of a general nature and may not address the specific circumstances of any individual or entity. It is not a substitute for professional advice or services. Any actions you take based on the information provided here are strictly at your own risk. You accept full responsibility for any decisions or outcomes arising from your use of this website and agree to release us from any liability in connection with your use of, or reliance upon, the content or products found herein.