
|
Xiamen Kingdomway Group Company (002626.sz) Avaliação DCF |
Totalmente Editável: Adapte-Se Às Suas Necessidades No Excel Ou Planilhas
Design Profissional: Modelos Confiáveis E Padrão Da Indústria
Pré-Construídos Para Uso Rápido E Eficiente
Compatível com MAC/PC, totalmente desbloqueado
Não É Necessária Experiência; Fácil De Seguir
Xiamen Kingdomway Group Company (002626.SZ) Bundle
Descubra o verdadeiro potencial da Xiamen Kingdomway Group Company com nossa calculadora DCF de nível profissional! Ajuste as principais premissas, explore vários cenários e avalie como os ajustes influenciam a avaliação da empresa do Xiamen Kingdomway Group - todos usando um único modelo do Excel.
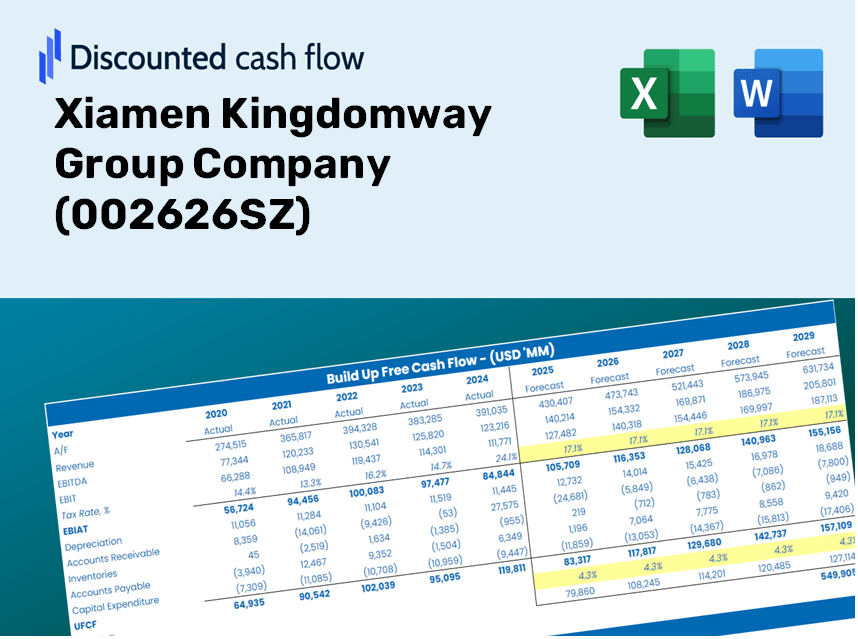
Discounted Cash Flow (DCF) - (USD MM)
| Year | AY1 2020 |
AY2 2021 |
AY3 2022 |
AY4 2023 |
AY5 2024 |
FY1 2025 |
FY2 2026 |
FY3 2027 |
FY4 2028 |
FY5 2029 |
|---|---|---|---|---|---|---|---|---|---|---|
| Revenue | 3,504.4 | 3,616.2 | 3,009.2 | 3,102.6 | 3,240.1 | 3,191.0 | 3,142.6 | 3,095.0 | 3,048.1 | 3,001.9 |
| Revenue Growth, % | 0 | 3.19 | -16.78 | 3.1 | 4.43 | -1.52 | -1.52 | -1.52 | -1.52 | -1.52 |
| EBITDA | 1,287.3 | 1,142.9 | 560.5 | 487.9 | 610.8 | 775.7 | 763.9 | 752.3 | 740.9 | 729.7 |
| EBITDA, % | 36.73 | 31.61 | 18.63 | 15.73 | 18.85 | 24.31 | 24.31 | 24.31 | 24.31 | 24.31 |
| Depreciation | 112.2 | 136.0 | 164.0 | 164.5 | 162.1 | 145.0 | 142.8 | 140.6 | 138.5 | 136.4 |
| Depreciation, % | 3.2 | 3.76 | 5.45 | 5.3 | 5 | 4.54 | 4.54 | 4.54 | 4.54 | 4.54 |
| EBIT | 1,175.1 | 1,006.9 | 396.5 | 323.3 | 448.8 | 630.7 | 621.1 | 611.7 | 602.5 | 593.3 |
| EBIT, % | 33.53 | 27.85 | 13.18 | 10.42 | 13.85 | 19.77 | 19.77 | 19.77 | 19.77 | 19.77 |
| Total Cash | 855.7 | 769.6 | 787.4 | 910.6 | 1,342.6 | 910.4 | 896.6 | 883.0 | 869.6 | 856.4 |
| Total Cash, percent | .0 | .0 | .0 | .0 | .0 | .0 | .0 | .0 | .0 | .0 |
| Account Receivables | 437.9 | 433.9 | 423.7 | 382.7 | 456.9 | 414.9 | 408.6 | 402.4 | 396.3 | 390.3 |
| Account Receivables, % | 12.5 | 12 | 14.08 | 12.34 | 14.1 | 13 | 13 | 13 | 13 | 13 |
| Inventories | 690.1 | 833.7 | 839.9 | 715.8 | 814.3 | 758.6 | 747.1 | 735.8 | 724.6 | 713.6 |
| Inventories, % | 19.69 | 23.06 | 27.91 | 23.07 | 25.13 | 23.77 | 23.77 | 23.77 | 23.77 | 23.77 |
| Accounts Payable | 273.6 | 254.8 | 131.1 | 286.5 | 364.2 | 253.3 | 249.4 | 245.6 | 241.9 | 238.2 |
| Accounts Payable, % | 7.81 | 7.05 | 4.36 | 9.23 | 11.24 | 7.94 | 7.94 | 7.94 | 7.94 | 7.94 |
| Capital Expenditure | -249.7 | -344.6 | -161.7 | -251.8 | -364.6 | -264.2 | -260.2 | -256.2 | -252.4 | -248.5 |
| Capital Expenditure, % | -7.13 | -9.53 | -5.37 | -8.12 | -11.25 | -8.28 | -8.28 | -8.28 | -8.28 | -8.28 |
| Tax Rate, % | 27.16 | 27.16 | 27.16 | 27.16 | 27.16 | 27.16 | 27.16 | 27.16 | 27.16 | 27.16 |
| EBITAT | 983.9 | 853.0 | 328.4 | 267.4 | 326.9 | 513.1 | 505.4 | 497.7 | 490.2 | 482.7 |
| Depreciation | ||||||||||
| Changes in Account Receivables | ||||||||||
| Changes in Inventories | ||||||||||
| Changes in Accounts Payable | ||||||||||
| Capital Expenditure | ||||||||||
| UFCF | -8.0 | 485.9 | 211.1 | 500.6 | 29.5 | 380.7 | 401.9 | 395.8 | 389.8 | 383.9 |
| WACC, % | 6.05 | 6.06 | 6.05 | 6.05 | 6.02 | 6.05 | 6.05 | 6.05 | 6.05 | 6.05 |
| PV UFCF | ||||||||||
| SUM PV UFCF | 1,642.7 | |||||||||
| Long Term Growth Rate, % | 3.00 | |||||||||
| Free cash flow (T + 1) | 395 | |||||||||
| Terminal Value | 12,976 | |||||||||
| Present Terminal Value | 9,675 | |||||||||
| Enterprise Value | 11,317 | |||||||||
| Net Debt | -85 | |||||||||
| Equity Value | 11,402 | |||||||||
| Diluted Shares Outstanding, MM | 610 | |||||||||
| Equity Value Per Share | 18.69 |
What You Will Receive
- Pre-Filled Financial Model: Xiamen Kingdomway Group Company’s actual data allows for accurate DCF valuation.
- Comprehensive Forecast Control: Modify revenue growth, profit margins, WACC, and other essential factors.
- Real-Time Calculations: Automatic updates provide immediate results as you make adjustments.
- Investor-Ready Template: A polished Excel file tailored for high-quality valuation presentations.
- Customizable and Reusable: Designed for adaptability, enabling repeated use for in-depth forecasts.
Key Features
- Genuine Xiamen Kingdomway Financials: Access precise pre-loaded historical data and forecasted projections.
- Customizable Forecast Parameters: Modify highlighted cells such as WACC, growth rates, and profit margins.
- Real-Time Calculations: Automatically refreshes DCF, Net Present Value (NPV), and cash flow analyses.
- User-Friendly Dashboard: Intuitive charts and summaries to effectively visualize your valuation results.
- Designed for All Users: A straightforward layout tailored for investors, CFOs, and consultants.
How It Works
- Step 1: Download the Excel file.
- Step 2: Review the pre-filled data for Xiamen Kingdomway Group Company (002626SZ) [Symbol] (historical and projected).
- Step 3: Modify key assumptions (highlighted in yellow) according to your analysis.
- Step 4: Observe automatic recalculations reflecting Xiamen Kingdomway Group Company’s (002626SZ) [Symbol] intrinsic value.
- Step 5: Utilize the outputs to inform your investment choices or reporting needs.
Why Choose This Calculator for Xiamen Kingdomway Group (002626SZ)?
- All-in-One Solution: Features DCF, WACC, and financial ratio analyses in a single platform.
- Flexible Inputs: Modify the yellow-highlighted fields to explore different scenarios.
- In-Depth Analysis: Automatically computes Xiamen Kingdomway's intrinsic value and Net Present Value.
- Preloaded Information: Historical and projected data provides a solid foundation for analysis.
- High-Quality Standards: Perfectly suited for financial analysts, investors, and business consultants.
Who Can Benefit from This Product?
- Investors: Accurately gauge the fair value of Xiamen Kingdomway Group (002626SZ) before making investment choices.
- CFOs: Utilize a professional-grade DCF model for comprehensive financial reporting and analysis.
- Consultants: Efficiently customize the template for client valuation reports.
- Entrepreneurs: Acquire insights into the financial modeling practices of leading companies.
- Educators: Employ this tool in the classroom to illustrate valuation techniques.
Contents of the Template
- Pre-Filled DCF Model: Xiamen Kingdomway Group Company’s (002626SZ) financial data preloaded for immediate use.
- WACC Calculator: In-depth calculations for Weighted Average Cost of Capital.
- Financial Ratios: Assess Xiamen Kingdomway Group's (002626SZ) profitability, leverage, and efficiency.
- Editable Inputs: Modify assumptions such as growth rates, margins, and CAPEX to suit your scenarios.
- Financial Statements: Annual and quarterly reports for comprehensive analysis.
- Interactive Dashboard: Effortlessly visualize key valuation metrics and outcomes.
Disclaimer
All information, articles, and product details provided on this website are for general informational and educational purposes only. We do not claim any ownership over, nor do we intend to infringe upon, any trademarks, copyrights, logos, brand names, or other intellectual property mentioned or depicted on this site. Such intellectual property remains the property of its respective owners, and any references here are made solely for identification or informational purposes, without implying any affiliation, endorsement, or partnership.
We make no representations or warranties, express or implied, regarding the accuracy, completeness, or suitability of any content or products presented. Nothing on this website should be construed as legal, tax, investment, financial, medical, or other professional advice. In addition, no part of this site—including articles or product references—constitutes a solicitation, recommendation, endorsement, advertisement, or offer to buy or sell any securities, franchises, or other financial instruments, particularly in jurisdictions where such activity would be unlawful.
All content is of a general nature and may not address the specific circumstances of any individual or entity. It is not a substitute for professional advice or services. Any actions you take based on the information provided here are strictly at your own risk. You accept full responsibility for any decisions or outcomes arising from your use of this website and agree to release us from any liability in connection with your use of, or reliance upon, the content or products found herein.