
|
Beyondsoft Corporation (002649.sz) Avaliação DCF |
Totalmente Editável: Adapte-Se Às Suas Necessidades No Excel Ou Planilhas
Design Profissional: Modelos Confiáveis E Padrão Da Indústria
Pré-Construídos Para Uso Rápido E Eficiente
Compatível com MAC/PC, totalmente desbloqueado
Não É Necessária Experiência; Fácil De Seguir
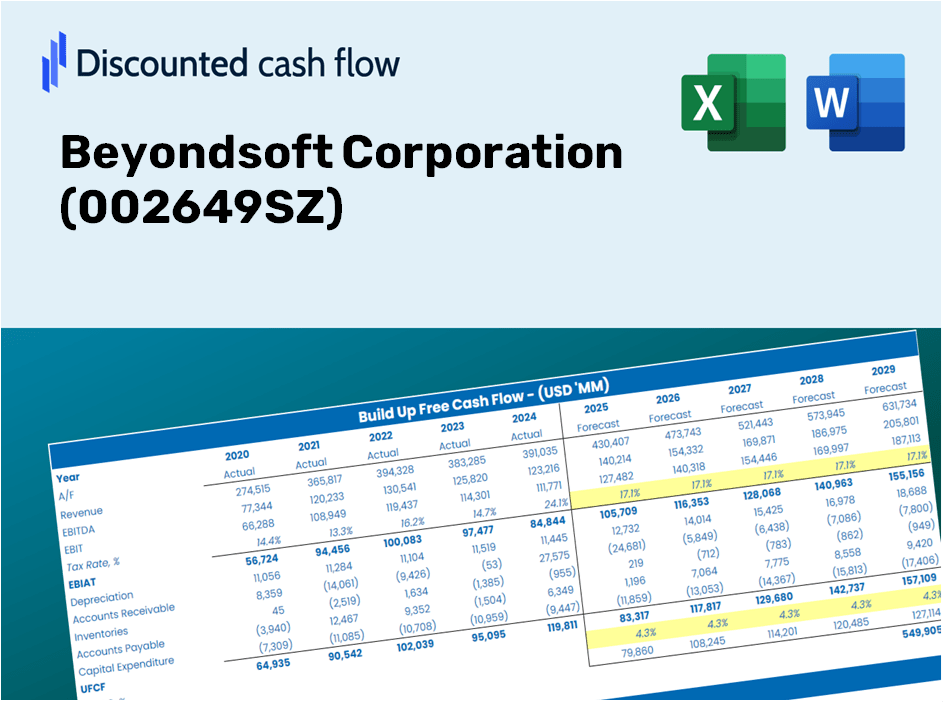
Beyondsoft Corporation (002649.SZ) Bundle
Otimize sua eficiência e melhore a precisão com a calculadora DCF (002649SZ)! Utilizando dados reais da BeyondSoft Corporation e suposições personalizáveis, essa ferramenta o capacita a prever, analisar e avaliar a BeyondSoft como um investidor experiente.
Discounted Cash Flow (DCF) - (USD MM)
| Year | AY1 2020 |
AY2 2021 |
AY3 2022 |
AY4 2023 |
AY5 2024 |
FY1 2025 |
FY2 2026 |
FY3 2027 |
FY4 2028 |
FY5 2029 |
|---|---|---|---|---|---|---|---|---|---|---|
| Revenue | 4,310.0 | 5,532.4 | 6,479.1 | 6,601.2 | 6,898.5 | 7,262.7 | 7,646.2 | 8,049.8 | 8,474.8 | 8,922.2 |
| Revenue Growth, % | 0 | 28.36 | 17.11 | 1.89 | 4.5 | 5.28 | 5.28 | 5.28 | 5.28 | 5.28 |
| EBITDA | 463.8 | 620.2 | 493.4 | 377.0 | 268.1 | 569.2 | 599.2 | 630.9 | 664.2 | 699.2 |
| EBITDA, % | 10.76 | 11.21 | 7.62 | 5.71 | 3.89 | 7.84 | 7.84 | 7.84 | 7.84 | 7.84 |
| Depreciation | 63.6 | 115.4 | 132.2 | 108.8 | 106.4 | 127.7 | 134.5 | 141.6 | 149.1 | 156.9 |
| Depreciation, % | 1.48 | 2.09 | 2.04 | 1.65 | 1.54 | 1.76 | 1.76 | 1.76 | 1.76 | 1.76 |
| EBIT | 400.2 | 504.8 | 361.2 | 268.1 | 161.7 | 441.4 | 464.8 | 489.3 | 515.1 | 542.3 |
| EBIT, % | 9.29 | 9.12 | 5.57 | 4.06 | 2.34 | 6.08 | 6.08 | 6.08 | 6.08 | 6.08 |
| Total Cash | 1,997.0 | 1,907.3 | 1,986.5 | 1,973.5 | 2,144.1 | 2,504.9 | 2,637.1 | 2,776.3 | 2,922.9 | 3,077.2 |
| Total Cash, percent | .0 | .0 | .0 | .0 | .0 | .0 | .0 | .0 | .0 | .0 |
| Account Receivables | 1,028.2 | 1,475.9 | 1,602.0 | 1,819.0 | 2,087.6 | 1,933.0 | 2,035.1 | 2,142.5 | 2,255.6 | 2,374.7 |
| Account Receivables, % | 23.86 | 26.68 | 24.73 | 27.56 | 30.26 | 26.62 | 26.62 | 26.62 | 26.62 | 26.62 |
| Inventories | 23.9 | 38.3 | 54.1 | 74.7 | 99.0 | 67.5 | 71.1 | 74.8 | 78.8 | 82.9 |
| Inventories, % | 0.55339 | 0.69254 | 0.83439 | 1.13 | 1.44 | 0.92936 | 0.92936 | 0.92936 | 0.92936 | 0.92936 |
| Accounts Payable | 89.6 | 102.9 | 101.8 | 131.4 | 171.8 | 145.1 | 152.8 | 160.9 | 169.4 | 178.3 |
| Accounts Payable, % | 2.08 | 1.86 | 1.57 | 1.99 | 2.49 | 2 | 2 | 2 | 2 | 2 |
| Capital Expenditure | -57.1 | -48.4 | -41.2 | -59.2 | -62.7 | -67.4 | -71.0 | -74.7 | -78.7 | -82.8 |
| Capital Expenditure, % | -1.33 | -0.87414 | -0.63607 | -0.89683 | -0.90936 | -0.92848 | -0.92848 | -0.92848 | -0.92848 | -0.92848 |
| Tax Rate, % | 16.6 | 16.6 | 16.6 | 16.6 | 16.6 | 16.6 | 16.6 | 16.6 | 16.6 | 16.6 |
| EBITAT | 338.6 | 425.1 | 322.8 | 225.5 | 134.9 | 375.8 | 395.7 | 416.5 | 438.5 | 461.7 |
| Depreciation | ||||||||||
| Changes in Account Receivables | ||||||||||
| Changes in Inventories | ||||||||||
| Changes in Accounts Payable | ||||||||||
| Capital Expenditure | ||||||||||
| UFCF | -617.4 | 43.3 | 270.8 | 67.1 | -73.9 | 595.5 | 361.2 | 380.3 | 400.3 | 421.5 |
| WACC, % | 5.1 | 5.1 | 5.1 | 5.1 | 5.09 | 5.1 | 5.1 | 5.1 | 5.1 | 5.1 |
| PV UFCF | ||||||||||
| SUM PV UFCF | 1,878.1 | |||||||||
| Long Term Growth Rate, % | 3.00 | |||||||||
| Free cash flow (T + 1) | 434 | |||||||||
| Terminal Value | 20,704 | |||||||||
| Present Terminal Value | 16,148 | |||||||||
| Enterprise Value | 18,026 | |||||||||
| Net Debt | -1,684 | |||||||||
| Equity Value | 19,710 | |||||||||
| Diluted Shares Outstanding, MM | 592 | |||||||||
| Equity Value Per Share | 33.31 |
What You Will Receive
- Adjustable Forecast Inputs: Effortlessly modify key assumptions (growth %, margins, WACC) to generate various scenarios.
- Current Market Data: Beyondsoft Corporation’s financial data pre-populated to enhance your analysis.
- Automated DCF Outputs: The template computes Net Present Value (NPV) and intrinsic value automatically.
- Tailored and Professional: A sleek Excel model that adjusts to your valuation requirements.
- Designed for Analysts and Investors: Perfect for evaluating projections, confirming strategies, and increasing efficiency.
Key Features
- 🔍 Real-Life Beyondsoft Financials: Pre-filled historical and projected data for Beyondsoft Corporation (002649SZ).
- ✏️ Fully Customizable Inputs: Modify all essential parameters (yellow cells) such as WACC, growth %, and tax rates.
- 📊 Professional DCF Valuation: Integrated formulas determine Beyondsoft's intrinsic value using the Discounted Cash Flow method.
- ⚡ Instant Results: Visualize Beyondsoft's valuation immediately after adjustments are made.
- Scenario Analysis: Evaluate and compare outcomes for different financial assumptions side-by-side.
How It Functions
- 1. Access the Template: Download and open the Excel file containing Beyondsoft Corporation’s preloaded data.
- 2. Modify Assumptions: Adjust key variables such as growth rates, WACC, and capital expenditures.
- 3. Instant Results: The DCF model automatically calculates intrinsic value and NPV in real-time.
- 4. Explore Scenarios: Analyze various forecasts to evaluate different valuation outcomes.
- 5. Make Informed Decisions: Deliver professional valuation insights to back your strategic choices.
Why Choose This Calculator for Beyondsoft Corporation (002649SZ)?
- Designed for Experts: A sophisticated tool tailored for analysts, CFOs, and consultants.
- Comprehensive Data: Beyondsoft’s historical and projected financials integrated for reliable insights.
- Flexible Scenario Analysis: Effortlessly explore various forecasts and assumptions.
- Intuitive Outputs: Automatically computes intrinsic value, NPV, and essential metrics.
- User-Friendly: Detailed step-by-step guidance to facilitate your calculations.
Who Can Benefit from This Product?
- Professional Investors: Create robust and accurate valuation models for comprehensive portfolio assessments.
- Corporate Finance Teams: Examine valuation scenarios to inform and enhance internal strategic decisions.
- Consultants and Advisors: Equip clients with precise valuation insights related to Beyondsoft Corporation (002649SZ).
- Students and Educators: Leverage real-world data for practicing and teaching financial modeling concepts.
- Tech Enthusiasts: Gain insights into the valuation processes of tech companies like Beyondsoft Corporation (002649SZ).
Contents of the Template
- Pre-Filled DCF Model: Beyondsoft Corporation's financial data preloaded for immediate application.
- WACC Calculator: Comprehensive calculations for the Weighted Average Cost of Capital.
- Financial Ratios: Assess Beyondsoft's profitability, leverage, and operational efficiency.
- Editable Inputs: Customize assumptions such as growth rates, margins, and CAPEX to suit your analysis.
- Financial Statements: Annual and quarterly reports available for in-depth analysis.
- Interactive Dashboard: Effortlessly visualize key valuation metrics and outcomes.
Disclaimer
All information, articles, and product details provided on this website are for general informational and educational purposes only. We do not claim any ownership over, nor do we intend to infringe upon, any trademarks, copyrights, logos, brand names, or other intellectual property mentioned or depicted on this site. Such intellectual property remains the property of its respective owners, and any references here are made solely for identification or informational purposes, without implying any affiliation, endorsement, or partnership.
We make no representations or warranties, express or implied, regarding the accuracy, completeness, or suitability of any content or products presented. Nothing on this website should be construed as legal, tax, investment, financial, medical, or other professional advice. In addition, no part of this site—including articles or product references—constitutes a solicitation, recommendation, endorsement, advertisement, or offer to buy or sell any securities, franchises, or other financial instruments, particularly in jurisdictions where such activity would be unlawful.
All content is of a general nature and may not address the specific circumstances of any individual or entity. It is not a substitute for professional advice or services. Any actions you take based on the information provided here are strictly at your own risk. You accept full responsibility for any decisions or outcomes arising from your use of this website and agree to release us from any liability in connection with your use of, or reliance upon, the content or products found herein.