
|
Sinodata Co., Ltd. (002657.sz) Avaliação DCF |
Totalmente Editável: Adapte-Se Às Suas Necessidades No Excel Ou Planilhas
Design Profissional: Modelos Confiáveis E Padrão Da Indústria
Pré-Construídos Para Uso Rápido E Eficiente
Compatível com MAC/PC, totalmente desbloqueado
Não É Necessária Experiência; Fácil De Seguir
Sinodata Co., Ltd. (002657.SZ) Bundle
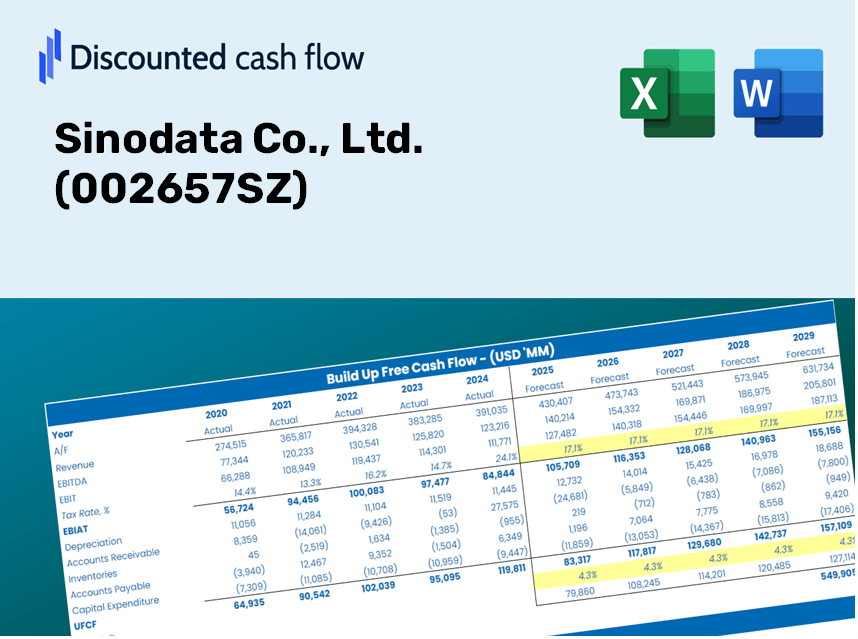
Projetado para precisão, nossa calculadora DCF (002657SZ) permite avaliar a avaliação Sinodata Co., Ltd. usando dados financeiros reais, oferecendo flexibilidade completa para modificar todos os parâmetros -chave para projeções aprimoradas.
Discounted Cash Flow (DCF) - (USD MM)
| Year | AY1 2020 |
AY2 2021 |
AY3 2022 |
AY4 2023 |
AY5 2024 |
FY1 2025 |
FY2 2026 |
FY3 2027 |
FY4 2028 |
FY5 2029 |
|---|---|---|---|---|---|---|---|---|---|---|
| Revenue | 1,758.4 | 1,606.1 | 1,233.0 | 1,001.9 | 1,166.8 | 1,067.1 | 975.9 | 892.5 | 816.3 | 746.5 |
| Revenue Growth, % | 0 | -8.66 | -23.23 | -18.74 | 16.46 | -8.54 | -8.54 | -8.54 | -8.54 | -8.54 |
| EBITDA | -3.5 | -89.9 | -16.4 | -82.2 | -64.7 | -44.6 | -40.8 | -37.3 | -34.1 | -31.2 |
| EBITDA, % | -0.1988 | -5.6 | -1.33 | -8.2 | -5.55 | -4.18 | -4.18 | -4.18 | -4.18 | -4.18 |
| Depreciation | 33.0 | 4.8 | 16.5 | 12.1 | 28.6 | 15.3 | 14.0 | 12.8 | 11.7 | 10.7 |
| Depreciation, % | 1.88 | 0.29799 | 1.33 | 1.2 | 2.45 | 1.43 | 1.43 | 1.43 | 1.43 | 1.43 |
| EBIT | -36.5 | -94.7 | -32.9 | -94.3 | -93.3 | -59.8 | -54.7 | -50.1 | -45.8 | -41.9 |
| EBIT, % | -2.07 | -5.89 | -2.67 | -9.41 | -8 | -5.61 | -5.61 | -5.61 | -5.61 | -5.61 |
| Total Cash | 656.6 | 845.6 | 667.7 | 879.6 | 608.7 | 606.3 | 554.5 | 507.1 | 463.8 | 424.2 |
| Total Cash, percent | .0 | .0 | .0 | .0 | .0 | .0 | .0 | .0 | .0 | .0 |
| Account Receivables | 199.3 | 164.9 | 123.1 | 112.5 | 201.0 | 128.2 | 117.2 | 107.2 | 98.0 | 89.7 |
| Account Receivables, % | 11.34 | 10.27 | 9.98 | 11.23 | 17.23 | 12.01 | 12.01 | 12.01 | 12.01 | 12.01 |
| Inventories | 505.2 | 605.1 | 492.2 | 309.0 | 361.7 | 358.9 | 328.2 | 300.2 | 274.5 | 251.1 |
| Inventories, % | 28.73 | 37.67 | 39.92 | 30.84 | 31 | 33.63 | 33.63 | 33.63 | 33.63 | 33.63 |
| Accounts Payable | 418.1 | 347.7 | 387.0 | 268.7 | 332.6 | 282.0 | 257.9 | 235.9 | 215.7 | 197.3 |
| Accounts Payable, % | 23.78 | 21.65 | 31.38 | 26.82 | 28.5 | 26.43 | 26.43 | 26.43 | 26.43 | 26.43 |
| Capital Expenditure | -54.9 | -21.7 | -1.0 | -130.7 | -72.5 | -50.8 | -46.5 | -42.5 | -38.9 | -35.5 |
| Capital Expenditure, % | -3.12 | -1.35 | -0.07898689 | -13.05 | -6.21 | -4.76 | -4.76 | -4.76 | -4.76 | -4.76 |
| Tax Rate, % | -0.61255 | -0.61255 | -0.61255 | -0.61255 | -0.61255 | -0.61255 | -0.61255 | -0.61255 | -0.61255 | -0.61255 |
| EBITAT | -15.0 | -101.9 | -33.9 | -104.4 | -93.9 | -52.8 | -48.3 | -44.2 | -40.4 | -36.9 |
| Depreciation | ||||||||||
| Changes in Account Receivables | ||||||||||
| Changes in Inventories | ||||||||||
| Changes in Accounts Payable | ||||||||||
| Capital Expenditure | ||||||||||
| UFCF | -323.4 | -254.6 | 175.5 | -147.4 | -215.1 | -63.2 | -63.3 | -57.9 | -52.9 | -48.4 |
| WACC, % | 4.92 | 4.94 | 4.94 | 4.94 | 4.94 | 4.93 | 4.93 | 4.93 | 4.93 | 4.93 |
| PV UFCF | ||||||||||
| SUM PV UFCF | -249.5 | |||||||||
| Long Term Growth Rate, % | 2.00 | |||||||||
| Free cash flow (T + 1) | -49 | |||||||||
| Terminal Value | -1,683 | |||||||||
| Present Terminal Value | -1,323 | |||||||||
| Enterprise Value | -1,572 | |||||||||
| Net Debt | -497 | |||||||||
| Equity Value | -1,075 | |||||||||
| Diluted Shares Outstanding, MM | 339 | |||||||||
| Equity Value Per Share | -3.17 |
What You Will Receive
- Authentic Sinodata Data: Preloaded financial metrics – encompassing revenue to EBIT – derived from actual and projected figures.
- Comprehensive Customization: Modify all essential parameters (yellow cells) such as WACC, growth %, and tax rates.
- Immediate Valuation Adjustments: Automatic recalculations to assess the effects of modifications on Sinodata’s fair value.
- Flexible Excel Template: Designed for quick edits, scenario analysis, and in-depth projections.
- Efficient and Precise: Eliminate the need to build models from the ground up while ensuring accuracy and adaptability.
Key Features
- Customizable Forecast Inputs: Adjust essential parameters such as revenue growth, EBITDA %, and capital expenditures effortlessly.
- Instant DCF Valuation: Quickly computes intrinsic value, NPV, and additional metrics at the click of a button.
- High Precision Accuracy: Relies on Sinodata Co., Ltd.'s (002657SZ) actual financial data for credible valuation results.
- Simplified Scenario Testing: Easily evaluate various assumptions and analyze their impacts on results.
- Efficiency Booster: Avoid the complexities of creating intricate valuation models from the ground up.
How It Works
- Step 1: Download the Excel file for Sinodata Co., Ltd. (002657SZ).
- Step 2: Examine the pre-filled financial data and forecasts for Sinodata Co., Ltd. (002657SZ).
- Step 3: Adjust key inputs such as revenue growth, WACC, and tax rates (highlighted cells).
- Step 4: Observe the DCF model update in real-time as you modify your assumptions.
- Step 5: Evaluate the outputs and leverage the results for your investment strategies.
Why Choose Sinodata Co., Ltd. (002657SZ)?
- User-Friendly Interface: Tailored for both novices and seasoned users.
- Customizable Parameters: Effortlessly adjust inputs to suit your analysis needs.
- Real-Time Updates: Witness immediate changes to Sinodata's valuation as you modify inputs.
- Preloaded Financials: Comes equipped with Sinodata’s latest financial figures for swift evaluations.
- Endorsed by Experts: Trusted by investors and analysts for making well-informed decisions.
Who Can Benefit from Sinodata Co., Ltd. (002657SZ)?
- Investors: Gain the insights needed to make informed investment choices with our advanced valuation tools.
- Financial Analysts: Enhance efficiency with our customizable DCF model designed for quick adaptation.
- Consultants: Effortlessly tailor the provided template for impactful client presentations and reports.
- Finance Enthusiasts: Expand your knowledge of valuation methods through practical, real-world scenarios.
- Educators and Students: Utilize this resource as a hands-on learning aid in finance courses.
Contents of the Template
- Preloaded Sinodata Data: Historical and forecasted financial metrics, including revenue, EBIT, and capital expenditures.
- DCF and WACC Models: Advanced sheets for calculating intrinsic value and the Weighted Average Cost of Capital.
- Editable Inputs: Cells highlighted in yellow for customizing assumptions about revenue growth, tax rates, and discount rates.
- Financial Statements: Detailed annual and quarterly financial reports for in-depth analysis.
- Key Ratios: Measures of profitability, leverage, and efficiency for performance evaluation.
- Dashboard and Charts: Visual representations of valuation results and underlying assumptions.
Disclaimer
All information, articles, and product details provided on this website are for general informational and educational purposes only. We do not claim any ownership over, nor do we intend to infringe upon, any trademarks, copyrights, logos, brand names, or other intellectual property mentioned or depicted on this site. Such intellectual property remains the property of its respective owners, and any references here are made solely for identification or informational purposes, without implying any affiliation, endorsement, or partnership.
We make no representations or warranties, express or implied, regarding the accuracy, completeness, or suitability of any content or products presented. Nothing on this website should be construed as legal, tax, investment, financial, medical, or other professional advice. In addition, no part of this site—including articles or product references—constitutes a solicitation, recommendation, endorsement, advertisement, or offer to buy or sell any securities, franchises, or other financial instruments, particularly in jurisdictions where such activity would be unlawful.
All content is of a general nature and may not address the specific circumstances of any individual or entity. It is not a substitute for professional advice or services. Any actions you take based on the information provided here are strictly at your own risk. You accept full responsibility for any decisions or outcomes arising from your use of this website and agree to release us from any liability in connection with your use of, or reliance upon, the content or products found herein.