
|
Guangdong Homa Group Co., Ltd. (002668.sz) Avaliação DCF |
Totalmente Editável: Adapte-Se Às Suas Necessidades No Excel Ou Planilhas
Design Profissional: Modelos Confiáveis E Padrão Da Indústria
Pré-Construídos Para Uso Rápido E Eficiente
Compatível com MAC/PC, totalmente desbloqueado
Não É Necessária Experiência; Fácil De Seguir
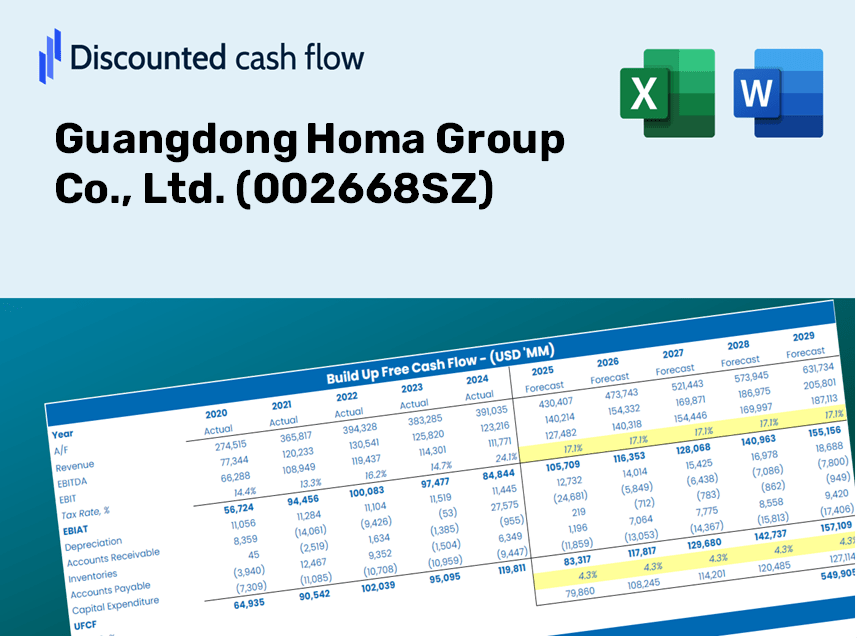
Guangdong Homa Group Co., Ltd. (002668.SZ) Bundle
Seja você um investidor ou analista, esta calculadora DCF (002668SZ) é sua ferramenta essencial para uma avaliação precisa. Pré -carregado com os dados reais de Guangdong Homa Group Co., Ltd., você pode ajustar as previsões e ver os efeitos em tempo real.
Discounted Cash Flow (DCF) - (USD MM)
| Year | AY1 2020 |
AY2 2021 |
AY3 2022 |
AY4 2023 |
AY5 2024 |
FY1 2025 |
FY2 2026 |
FY3 2027 |
FY4 2028 |
FY5 2029 |
|---|---|---|---|---|---|---|---|---|---|---|
| Revenue | 8,345.1 | 10,122.1 | 11,663.2 | 15,179.6 | 18,360.8 | 22,383.0 | 27,286.3 | 33,263.7 | 40,550.5 | 49,433.6 |
| Revenue Growth, % | 0 | 21.29 | 15.23 | 30.15 | 20.96 | 21.91 | 21.91 | 21.91 | 21.91 | 21.91 |
| EBITDA | 277.3 | 559.6 | 1,174.5 | 1,931.4 | 2,287.2 | 1,974.3 | 2,406.8 | 2,934.0 | 3,576.7 | 4,360.2 |
| EBITDA, % | 3.32 | 5.53 | 10.07 | 12.72 | 12.46 | 8.82 | 8.82 | 8.82 | 8.82 | 8.82 |
| Depreciation | 212.6 | 132.1 | 333.0 | 258.9 | 294.9 | 448.5 | 546.8 | 666.6 | 812.6 | 990.6 |
| Depreciation, % | 2.55 | 1.31 | 2.86 | 1.71 | 1.61 | 2 | 2 | 2 | 2 | 2 |
| EBIT | 64.7 | 427.5 | 841.5 | 1,672.6 | 1,992.3 | 1,525.7 | 1,860.0 | 2,267.4 | 2,764.1 | 3,369.7 |
| EBIT, % | 0.77524 | 4.22 | 7.21 | 11.02 | 10.85 | 6.82 | 6.82 | 6.82 | 6.82 | 6.82 |
| Total Cash | 4,781.8 | 3,291.2 | 2,649.5 | 3,542.3 | 3,301.6 | 6,887.2 | 8,396.0 | 10,235.2 | 12,477.4 | 15,210.7 |
| Total Cash, percent | .0 | .0 | .0 | .0 | .0 | .0 | .0 | .0 | .0 | .0 |
| Account Receivables | 1,476.6 | 1,268.8 | .0 | 3,927.1 | 4,650.5 | 3,645.3 | 4,443.8 | 5,417.3 | 6,604.0 | 8,050.7 |
| Account Receivables, % | 17.69 | 12.54 | 0 | 25.87 | 25.33 | 16.29 | 16.29 | 16.29 | 16.29 | 16.29 |
| Inventories | 718.5 | 891.5 | 908.7 | 1,540.7 | 1,772.9 | 2,015.1 | 2,456.6 | 2,994.7 | 3,650.7 | 4,450.5 |
| Inventories, % | 8.61 | 8.81 | 7.79 | 10.15 | 9.66 | 9 | 9 | 9 | 9 | 9 |
| Accounts Payable | 1,260.1 | 4,061.8 | 2,986.7 | 7,870.7 | 8,892.4 | 8,107.9 | 9,884.0 | 12,049.3 | 14,688.8 | 17,906.6 |
| Accounts Payable, % | 15.1 | 40.13 | 25.61 | 51.85 | 48.43 | 36.22 | 36.22 | 36.22 | 36.22 | 36.22 |
| Capital Expenditure | -80.2 | -202.9 | -296.1 | -486.6 | -698.1 | -560.1 | -682.8 | -832.4 | -1,014.7 | -1,237.0 |
| Capital Expenditure, % | -0.96131 | -2 | -2.54 | -3.21 | -3.8 | -2.5 | -2.5 | -2.5 | -2.5 | -2.5 |
| Tax Rate, % | 54.47 | 54.47 | 54.47 | 54.47 | 54.47 | 54.47 | 54.47 | 54.47 | 54.47 | 54.47 |
| EBITAT | 145.9 | -67.4 | 360.2 | 739.8 | 907.1 | 709.7 | 865.1 | 1,054.7 | 1,285.7 | 1,567.4 |
| Depreciation | ||||||||||
| Changes in Account Receivables | ||||||||||
| Changes in Inventories | ||||||||||
| Changes in Accounts Payable | ||||||||||
| Capital Expenditure | ||||||||||
| UFCF | -656.8 | 2,698.3 | 573.7 | 837.0 | 570.0 | 576.6 | 1,265.3 | 1,542.5 | 1,880.3 | 2,292.3 |
| WACC, % | 4.81 | 4.19 | 4.45 | 4.46 | 4.47 | 4.48 | 4.48 | 4.48 | 4.48 | 4.48 |
| PV UFCF | ||||||||||
| SUM PV UFCF | 6,483.2 | |||||||||
| Long Term Growth Rate, % | 2.00 | |||||||||
| Free cash flow (T + 1) | 2,338 | |||||||||
| Terminal Value | 94,377 | |||||||||
| Present Terminal Value | 75,815 | |||||||||
| Enterprise Value | 82,298 | |||||||||
| Net Debt | -1,660 | |||||||||
| Equity Value | 83,958 | |||||||||
| Diluted Shares Outstanding, MM | 1,084 | |||||||||
| Equity Value Per Share | 77.43 |
What You Will Receive
- Edit-Friendly Forecast Inputs: Effortlessly adjust parameters (growth %, margins, WACC) to generate various scenarios.
- Real-Time Data: Guangdong Homa Group’s financial information pre-loaded to streamline your analysis.
- Automated DCF Calculations: The template computes Net Present Value (NPV) and intrinsic value for you.
- Customizable and Professional Design: A refined Excel model tailored to fit your valuation requirements.
- Designed for Analysts and Investors: Perfect for evaluating forecasts, validating strategies, and enhancing efficiency.
Key Features
- Comprehensive DCF Calculator: Features both unlevered and levered DCF valuation models for in-depth analysis.
- WACC Calculator: A ready-to-use Weighted Average Cost of Capital template with adjustable parameters.
- Customizable Forecast Assumptions: Adapt growth rates, capital expenditures, and discount rates to fit your projections.
- Integrated Financial Ratios: Assess profitability, leverage, and efficiency ratios specific to Guangdong Homa Group Co., Ltd. (002668SZ).
- Interactive Dashboard and Charts: Visual representations provide a clear summary of essential valuation metrics for straightforward analysis.
How It Operates
- Step 1: Download the prebuilt Excel template containing Guangdong Homa Group Co., Ltd.'s (002668SZ) data.
- Step 2: Review the pre-filled sheets to grasp the essential metrics.
- Step 3: Adjust forecasts and assumptions in the editable yellow cells (WACC, growth, margins).
- Step 4: Immediately see the recalculated results, including the intrinsic value of Guangdong Homa Group Co., Ltd. (002668SZ).
- Step 5: Use the outputs to make informed investment choices or create reports.
Why Opt for the Homa Group Financial Calculator?
- All-in-One Solution: Features DCF, WACC, and comprehensive financial ratio analyses in a single platform.
- Flexible Input Options: Modify the yellow-highlighted fields to explore different financial scenarios.
- In-Depth Analysis: Automatically computes the intrinsic value and Net Present Value for Guangdong Homa Group (002668SZ).
- Data Ready for Use: Comes with historical and projected data for precise analysis beginnings.
- High-Quality Output: Perfectly suited for financial analysts, investors, and business consultants.
Who Can Benefit from This Product?
- Investors: Efficiently determine the fair value of Guangdong Homa Group Co., Ltd. (002668SZ) ahead of making investment moves.
- CFOs: Utilize a top-tier DCF model for accurate financial reporting and comprehensive analysis.
- Consultants: Seamlessly customize the template for crafting valuation reports tailored to client needs.
- Entrepreneurs: Acquire valuable insights into financial modeling practices employed by leading companies.
- Educators: Implement it as a resource to illustrate various valuation methodologies for students.
Contents of the Template
- Preloaded 002668SZ Data: Historical and forecasted financial information, including revenue, EBIT, and capital expenditures.
- DCF and WACC Models: Professional-grade spreadsheets for determining intrinsic value and Weighted Average Cost of Capital.
- Editable Inputs: Yellow-highlighted cells for modifying revenue growth rates, tax rates, and discount rates.
- Financial Statements: Detailed annual and quarterly financial reports for comprehensive analysis.
- Key Ratios: Ratios on profitability, leverage, and efficiency to assess overall performance.
- Dashboard and Charts: Visual representations of valuation results and underlying assumptions.
Disclaimer
All information, articles, and product details provided on this website are for general informational and educational purposes only. We do not claim any ownership over, nor do we intend to infringe upon, any trademarks, copyrights, logos, brand names, or other intellectual property mentioned or depicted on this site. Such intellectual property remains the property of its respective owners, and any references here are made solely for identification or informational purposes, without implying any affiliation, endorsement, or partnership.
We make no representations or warranties, express or implied, regarding the accuracy, completeness, or suitability of any content or products presented. Nothing on this website should be construed as legal, tax, investment, financial, medical, or other professional advice. In addition, no part of this site—including articles or product references—constitutes a solicitation, recommendation, endorsement, advertisement, or offer to buy or sell any securities, franchises, or other financial instruments, particularly in jurisdictions where such activity would be unlawful.
All content is of a general nature and may not address the specific circumstances of any individual or entity. It is not a substitute for professional advice or services. Any actions you take based on the information provided here are strictly at your own risk. You accept full responsibility for any decisions or outcomes arising from your use of this website and agree to release us from any liability in connection with your use of, or reliance upon, the content or products found herein.