
|
Guangdong Hongda Holdings Group Co., Ltd. (002683.sz) Avaliação DCF |
Totalmente Editável: Adapte-Se Às Suas Necessidades No Excel Ou Planilhas
Design Profissional: Modelos Confiáveis E Padrão Da Indústria
Pré-Construídos Para Uso Rápido E Eficiente
Compatível com MAC/PC, totalmente desbloqueado
Não É Necessária Experiência; Fácil De Seguir
Guangdong Hongda Holdings Group Co., Ltd. (002683.SZ) Bundle
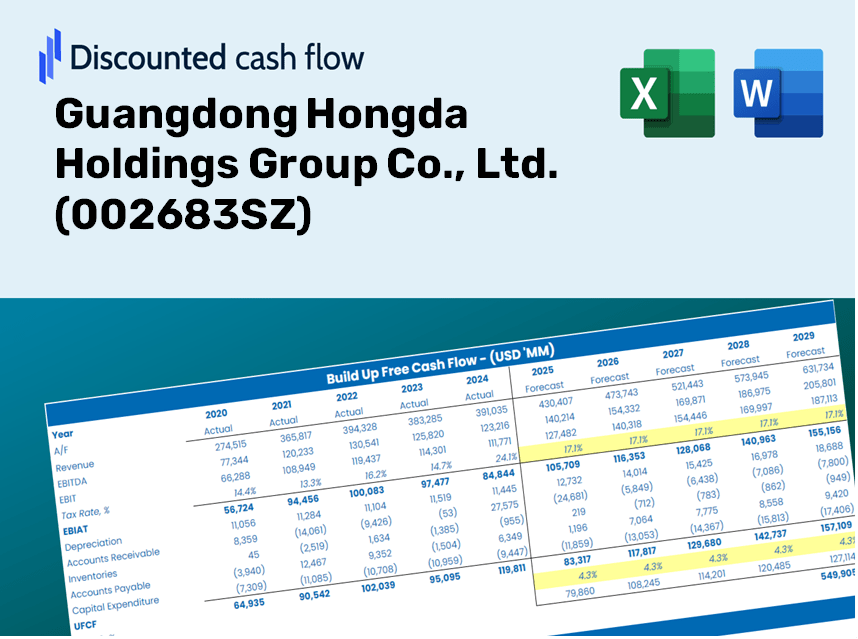
Explore as perspectivas financeiras do Guangdong Hongda Holdings Group Co., Ltd. (002683SZ) com a nossa calculadora DCF amigável! Digite suas suposições sobre crescimento, margens de lucro e despesas para calcular o valor intrínseco do Guangdong Hongda Holdings Group Co., Ltd. (002683SZ) e aprimore sua estratégia de investimento.
Discounted Cash Flow (DCF) - (USD MM)
| Year | AY1 2020 |
AY2 2021 |
AY3 2022 |
AY4 2023 |
AY5 2024 |
FY1 2025 |
FY2 2026 |
FY3 2027 |
FY4 2028 |
FY5 2029 |
|---|---|---|---|---|---|---|---|---|---|---|
| Revenue | 6,394.9 | 8,526.5 | 10,168.8 | 11,608.0 | 13,651.9 | 16,530.9 | 20,017.1 | 24,238.4 | 29,350.0 | 35,539.6 |
| Revenue Growth, % | 0 | 33.33 | 19.26 | 14.15 | 17.61 | 21.09 | 21.09 | 21.09 | 21.09 | 21.09 |
| EBITDA | 834.0 | 1,152.6 | 1,325.4 | 1,519.2 | 1,849.6 | 2,189.7 | 2,651.5 | 3,210.6 | 3,887.7 | 4,707.6 |
| EBITDA, % | 13.04 | 13.52 | 13.03 | 13.09 | 13.55 | 13.25 | 13.25 | 13.25 | 13.25 | 13.25 |
| Depreciation | 207.4 | 303.6 | 358.2 | 399.7 | 457.2 | 566.0 | 685.3 | 829.9 | 1,004.9 | 1,216.8 |
| Depreciation, % | 3.24 | 3.56 | 3.52 | 3.44 | 3.35 | 3.42 | 3.42 | 3.42 | 3.42 | 3.42 |
| EBIT | 626.5 | 849.1 | 967.2 | 1,119.5 | 1,392.5 | 1,623.7 | 1,966.1 | 2,380.8 | 2,882.8 | 3,490.8 |
| EBIT, % | 9.8 | 9.96 | 9.51 | 9.64 | 10.2 | 9.82 | 9.82 | 9.82 | 9.82 | 9.82 |
| Total Cash | 3,061.7 | 3,170.1 | 3,163.0 | 3,339.2 | 4,296.7 | 5,832.1 | 7,062.1 | 8,551.4 | 10,354.8 | 12,538.5 |
| Total Cash, percent | .0 | .0 | .0 | .0 | .0 | .0 | .0 | .0 | .0 | .0 |
| Account Receivables | 3,019.6 | 3,503.8 | 4,610.8 | 4,741.3 | 5,491.8 | 7,099.3 | 8,596.4 | 10,409.3 | 12,604.5 | 15,262.6 |
| Account Receivables, % | 47.22 | 41.09 | 45.34 | 40.85 | 40.23 | 42.95 | 42.95 | 42.95 | 42.95 | 42.95 |
| Inventories | 181.8 | 424.9 | 404.1 | 391.1 | 391.0 | 596.2 | 722.0 | 874.2 | 1,058.6 | 1,281.8 |
| Inventories, % | 2.84 | 4.98 | 3.97 | 3.37 | 2.86 | 3.61 | 3.61 | 3.61 | 3.61 | 3.61 |
| Accounts Payable | 1,027.0 | 1,207.4 | 2,337.2 | 2,449.0 | 3,324.9 | 3,261.8 | 3,949.7 | 4,782.6 | 5,791.2 | 7,012.5 |
| Accounts Payable, % | 16.06 | 14.16 | 22.98 | 21.1 | 24.35 | 19.73 | 19.73 | 19.73 | 19.73 | 19.73 |
| Capital Expenditure | -372.2 | -647.3 | -721.2 | -860.6 | -669.6 | -1,085.2 | -1,314.0 | -1,591.1 | -1,926.7 | -2,333.0 |
| Capital Expenditure, % | -5.82 | -7.59 | -7.09 | -7.41 | -4.9 | -6.56 | -6.56 | -6.56 | -6.56 | -6.56 |
| Tax Rate, % | 34.09 | 34.09 | 34.09 | 34.09 | 34.09 | 34.09 | 34.09 | 34.09 | 34.09 | 34.09 |
| EBITAT | 440.7 | 506.1 | 561.2 | 707.5 | 917.7 | 1,029.7 | 1,246.8 | 1,509.8 | 1,828.2 | 2,213.7 |
| Depreciation | ||||||||||
| Changes in Account Receivables | ||||||||||
| Changes in Inventories | ||||||||||
| Changes in Accounts Payable | ||||||||||
| Capital Expenditure | ||||||||||
| UFCF | -1,898.5 | -384.5 | 242.0 | 240.8 | 830.8 | -1,365.3 | -316.9 | -383.7 | -464.6 | -562.6 |
| WACC, % | 5.16 | 5.1 | 5.1 | 5.12 | 5.14 | 5.12 | 5.12 | 5.12 | 5.12 | 5.12 |
| PV UFCF | ||||||||||
| SUM PV UFCF | -2,734.3 | |||||||||
| Long Term Growth Rate, % | 3.50 | |||||||||
| Free cash flow (T + 1) | -582 | |||||||||
| Terminal Value | -35,839 | |||||||||
| Present Terminal Value | -27,914 | |||||||||
| Enterprise Value | -30,649 | |||||||||
| Net Debt | 2,256 | |||||||||
| Equity Value | -32,905 | |||||||||
| Diluted Shares Outstanding, MM | 742 | |||||||||
| Equity Value Per Share | -44.34 |
What You Will Receive
- Authentic 002683 Financials: Features both historical and projected data for precise valuation.
- Customizable Inputs: Adjust WACC, tax rates, revenue growth, and capital expenditures as needed.
- Automated Calculations: Intrinsic value and NPV are computed in real-time.
- Scenario Analysis: Evaluate various scenarios to assess the future performance of Guangdong Hongda Holdings.
- User-Friendly Design: Crafted for professionals while remaining easy to navigate for newcomers.
Key Features
- Real-Time 002683SZ Data: Pre-loaded with Guangdong Hongda Holdings Group's historical financial performance and future projections.
- Comprehensive Customization Options: Tailor revenue growth, profit margins, WACC, tax rates, and capital expenditures to your preferences.
- Dynamic Valuation Framework: Automatic recalculations of Net Present Value (NPV) and intrinsic value based on your customized inputs.
- Scenario Analysis Capabilities: Develop various forecasting scenarios to explore different valuation possibilities.
- Intuitive User Interface: Designed for ease of use, catering to both industry professionals and novices.
How It Works
- Download: Obtain the pre-formatted Excel file containing Guangdong Hongda Holdings Group Co., Ltd.'s (002683SZ) financial information.
- Customize: Modify projections such as revenue growth, EBITDA %, and WACC as needed.
- Update Automatically: The intrinsic value and NPV calculations refresh in real-time.
- Test Scenarios: Generate various forecasts and evaluate results immediately.
- Make Decisions: Utilize the valuation insights to inform your investment choices.
Why Opt for This Calculator?
- Designed for Experts: A sophisticated tool utilized by analysts, CFOs, and industry consultants.
- Accurate Data: Historical and projected financials of Guangdong Hongda Holdings Group Co., Ltd. (002683SZ) are preloaded for reliability.
- Flexible Scenario Analysis: Easily simulate various forecasts and assumptions.
- Intuitive Outputs: Automatically computes intrinsic value, NPV, and essential financial metrics.
- User-Friendly: Comprehensive step-by-step instructions to simplify your experience.
Who Should Consider This Product?
- Individual Investors: Make informed choices when buying or selling Guangdong Hongda Holdings Group Co., Ltd. (002683SZ).
- Financial Analysts: Enhance valuation processes with readily available financial models.
- Consultants: Provide clients with rapid and precise valuation insights.
- Business Owners: Gain insights into how large firms like Guangdong Hongda are valued to inform your own business strategy.
- Finance Students: Study valuation methods through practical data and real-world scenarios.
Contents of the Template
- Comprehensive DCF Model: An editable template featuring in-depth valuation calculations.
- Real-World Data: Historical and projected financials for Guangdong Hongda Holdings Group Co., Ltd. (002683SZ) preloaded for your analysis.
- Customizable Parameters: Modify WACC, growth rates, and tax assumptions to explore various scenarios.
- Financial Statements: Detailed annual and quarterly breakdowns for enhanced insights.
- Key Ratios: Integrated analysis of profitability, efficiency, and leverage metrics.
- Dashboard with Visual Outputs: Visualizations such as charts and tables for clear, actionable insights.
Disclaimer
All information, articles, and product details provided on this website are for general informational and educational purposes only. We do not claim any ownership over, nor do we intend to infringe upon, any trademarks, copyrights, logos, brand names, or other intellectual property mentioned or depicted on this site. Such intellectual property remains the property of its respective owners, and any references here are made solely for identification or informational purposes, without implying any affiliation, endorsement, or partnership.
We make no representations or warranties, express or implied, regarding the accuracy, completeness, or suitability of any content or products presented. Nothing on this website should be construed as legal, tax, investment, financial, medical, or other professional advice. In addition, no part of this site—including articles or product references—constitutes a solicitation, recommendation, endorsement, advertisement, or offer to buy or sell any securities, franchises, or other financial instruments, particularly in jurisdictions where such activity would be unlawful.
All content is of a general nature and may not address the specific circumstances of any individual or entity. It is not a substitute for professional advice or services. Any actions you take based on the information provided here are strictly at your own risk. You accept full responsibility for any decisions or outcomes arising from your use of this website and agree to release us from any liability in connection with your use of, or reliance upon, the content or products found herein.