
|
Yixintang Pharmaceutical Group Co., Ltd. (002727.sz) Avaliação DCF |
Totalmente Editável: Adapte-Se Às Suas Necessidades No Excel Ou Planilhas
Design Profissional: Modelos Confiáveis E Padrão Da Indústria
Pré-Construídos Para Uso Rápido E Eficiente
Compatível com MAC/PC, totalmente desbloqueado
Não É Necessária Experiência; Fácil De Seguir
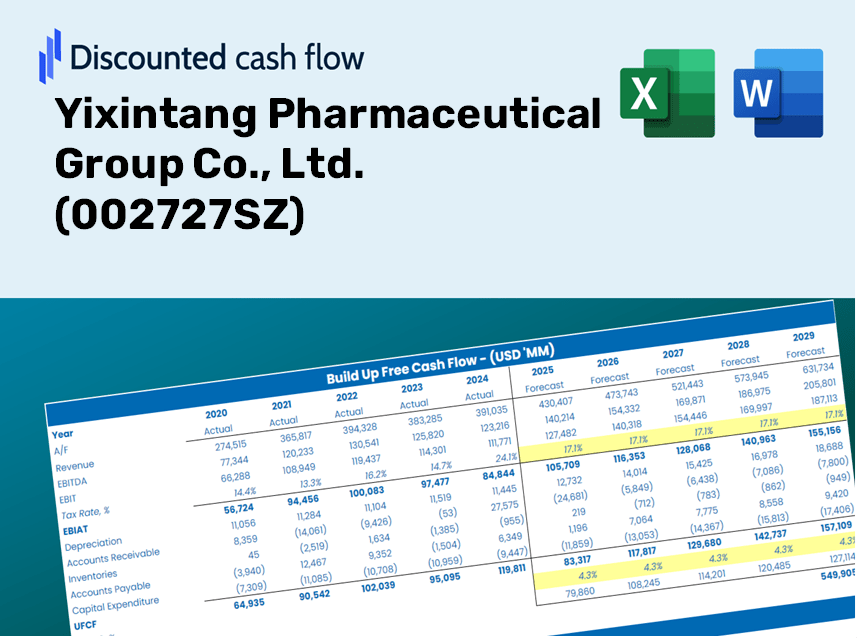
Yixintang Pharmaceutical Group Co., Ltd. (002727.SZ) Bundle
Projetado para precisão, nossa calculadora DCF (002727SZ) permite avaliar a avaliação do Yixintang Pharmaceutical Group Co., Ltd. usando informações financeiras do mundo real e completa flexibilidade para modificar todos os parâmetros-chave para projeções aprimoradas.
Discounted Cash Flow (DCF) - (USD MM)
| Year | AY1 2020 |
AY2 2021 |
AY3 2022 |
AY4 2023 |
AY5 2024 |
FY1 2025 |
FY2 2026 |
FY3 2027 |
FY4 2028 |
FY5 2029 |
|---|---|---|---|---|---|---|---|---|---|---|
| Revenue | 12,656.3 | 14,587.4 | 17,431.6 | 17,380.3 | 18,000.5 | 18,671.8 | 19,368.3 | 20,090.7 | 20,840.0 | 21,617.3 |
| Revenue Growth, % | 0 | 15.26 | 19.5 | -0.29432 | 3.57 | 3.73 | 3.73 | 3.73 | 3.73 | 3.73 |
| EBITDA | 979.6 | 1,283.5 | 1,432.2 | 968.6 | 492.8 | 1,234.8 | 1,280.8 | 1,328.6 | 1,378.1 | 1,429.5 |
| EBITDA, % | 7.74 | 8.8 | 8.22 | 5.57 | 2.74 | 6.61 | 6.61 | 6.61 | 6.61 | 6.61 |
| Depreciation | 79.8 | 98.1 | 114.5 | 124.7 | 109.5 | 122.7 | 127.3 | 132.0 | 136.9 | 142.0 |
| Depreciation, % | 0.63037 | 0.67239 | 0.65662 | 0.71727 | 0.60838 | 0.65701 | 0.65701 | 0.65701 | 0.65701 | 0.65701 |
| EBIT | 899.8 | 1,185.4 | 1,317.7 | 843.9 | 383.3 | 1,112.1 | 1,153.6 | 1,196.6 | 1,241.2 | 1,287.5 |
| EBIT, % | 7.11 | 8.13 | 7.56 | 4.86 | 2.13 | 5.96 | 5.96 | 5.96 | 5.96 | 5.96 |
| Total Cash | 1,624.0 | 2,532.4 | 3,520.0 | 3,895.3 | 3,417.7 | 3,427.5 | 3,555.4 | 3,688.0 | 3,825.5 | 3,968.2 |
| Total Cash, percent | .0 | .0 | .0 | .0 | .0 | .0 | .0 | .0 | .0 | .0 |
| Account Receivables | 943.6 | 1,582.7 | 2,059.8 | 1,555.1 | 1,902.7 | 1,853.7 | 1,922.9 | 1,994.6 | 2,069.0 | 2,146.1 |
| Account Receivables, % | 7.46 | 10.85 | 11.82 | 8.95 | 10.57 | 9.93 | 9.93 | 9.93 | 9.93 | 9.93 |
| Inventories | 2,194.5 | 3,317.0 | 3,387.4 | 3,852.6 | 4,087.7 | 3,898.1 | 4,043.5 | 4,194.4 | 4,350.8 | 4,513.1 |
| Inventories, % | 17.34 | 22.74 | 19.43 | 22.17 | 22.71 | 20.88 | 20.88 | 20.88 | 20.88 | 20.88 |
| Accounts Payable | 2,875.8 | 3,805.9 | 4,328.8 | 2,560.2 | 4,916.2 | 4,320.2 | 4,481.3 | 4,648.5 | 4,821.8 | 5,001.7 |
| Accounts Payable, % | 22.72 | 26.09 | 24.83 | 14.73 | 27.31 | 23.14 | 23.14 | 23.14 | 23.14 | 23.14 |
| Capital Expenditure | -280.2 | -391.6 | -349.0 | -253.5 | -254.8 | -365.0 | -378.6 | -392.8 | -407.4 | -422.6 |
| Capital Expenditure, % | -2.21 | -2.68 | -2 | -1.46 | -1.42 | -1.95 | -1.95 | -1.95 | -1.95 | -1.95 |
| Tax Rate, % | 44.94 | 44.94 | 44.94 | 44.94 | 44.94 | 44.94 | 44.94 | 44.94 | 44.94 | 44.94 |
| EBITAT | 742.8 | 996.3 | 1,077.7 | 660.0 | 211.0 | 848.8 | 880.5 | 913.3 | 947.4 | 982.7 |
| Depreciation | ||||||||||
| Changes in Account Receivables | ||||||||||
| Changes in Inventories | ||||||||||
| Changes in Accounts Payable | ||||||||||
| Capital Expenditure | ||||||||||
| UFCF | 280.2 | -128.8 | 818.6 | -1,197.8 | 1,838.9 | 249.1 | 575.7 | 597.2 | 619.5 | 642.6 |
| WACC, % | 6.87 | 6.89 | 6.86 | 6.81 | 6.47 | 6.78 | 6.78 | 6.78 | 6.78 | 6.78 |
| PV UFCF | ||||||||||
| SUM PV UFCF | 2,168.2 | |||||||||
| Long Term Growth Rate, % | 3.00 | |||||||||
| Free cash flow (T + 1) | 662 | |||||||||
| Terminal Value | 17,512 | |||||||||
| Present Terminal Value | 12,616 | |||||||||
| Enterprise Value | 14,784 | |||||||||
| Net Debt | -1,391 | |||||||||
| Equity Value | 16,175 | |||||||||
| Diluted Shares Outstanding, MM | 592 | |||||||||
| Equity Value Per Share | 27.31 |
Benefits You Will Receive
- Authentic YXT Financial Data: Pre-filled with Yixintang Pharmaceutical Group’s historical and projected figures for accurate analysis.
- Completely Customizable Template: Easily adjust critical inputs such as revenue growth, WACC, and EBITDA percentage.
- Instant Calculations: Watch the intrinsic value of Yixintang updates immediately as you make changes.
- Expert Valuation Tool: Tailored for investors, analysts, and consultants who require precise DCF results.
- Intuitive Design: A straightforward layout and clear guidance suitable for users of all experience levels.
Key Features
- Comprehensive DCF Calculator: Features detailed unlevered and levered DCF valuation models tailored for Yixintang Pharmaceutical Group Co., Ltd. (002727SZ).
- WACC Calculator: Includes a pre-built Weighted Average Cost of Capital sheet with inputs that can be easily customized.
- Editability of Forecast Assumptions: Adjust growth rates, capital expenditures, and discount rates to fit your analysis needs.
- Integrated Financial Ratios: Evaluate profitability, leverage, and efficiency ratios specifically for Yixintang Pharmaceutical Group Co., Ltd. (002727SZ).
- Interactive Dashboard and Charts: Visual representations of key valuation metrics facilitate straightforward analysis.
How It Operates
- 1. Access the Template: Download and open the Excel file containing Yixintang Pharmaceutical Group Co., Ltd. (002727SZ) preloaded data.
- 2. Update Assumptions: Modify essential inputs such as growth rates, WACC, and capital expenditures.
- 3. Analyze Results in Real-Time: The DCF model automatically calculates intrinsic value and NPV.
- 4. Explore Scenarios: Evaluate various forecasts to assess different valuation outcomes.
- 5. Present with Assurance: Share professional valuation insights to back your strategic decisions.
Why Opt for This Calculator?
- Reliable Data: Accurate financials from Yixintang Pharmaceutical Group Co., Ltd. ensure trustworthy valuation outcomes.
- Tailored Settings: Modify essential parameters such as growth rates, WACC, and tax rates to suit your forecasts.
- Efficiency-Boosting: Built-in calculations save you time by eliminating the need for a blank slate.
- Expert-Level Tool: Crafted for investors, analysts, and consultants in the pharmaceutical sector.
- Easy to Use: User-friendly design and straightforward instructions cater to all experience levels.
Who Can Benefit from Yixintang Pharmaceutical Group Co., Ltd. (002727SZ)?
- Investors: Make informed decisions with our comprehensive valuation resources.
- Financial Analysts: Streamline your analysis using our customizable financial models.
- Consultants: Effortlessly tailor our templates for impactful client presentations or reports.
- Pharmaceutical Enthusiasts: Enhance your knowledge of industry valuation practices through real-case studies.
- Educators and Students: Leverage our tools as practical aids in pharmaceutical finance courses.
Contents of the Template
- Preloaded Yixintang Data: Historical and projected financial metrics, including revenue, EBIT, and capital expenditures.
- DCF and WACC Models: Advanced spreadsheets designed for calculating intrinsic value and Weighted Average Cost of Capital.
- Editable Inputs: Cells highlighted in yellow for modifying revenue growth, tax rates, and discount rates.
- Financial Statements: Detailed annual and quarterly financial reports for in-depth analysis.
- Key Ratios: Ratios related to profitability, leverage, and efficiency for performance assessment.
- Dashboard and Charts: Visual representations of valuation results and underlying assumptions.
Disclaimer
All information, articles, and product details provided on this website are for general informational and educational purposes only. We do not claim any ownership over, nor do we intend to infringe upon, any trademarks, copyrights, logos, brand names, or other intellectual property mentioned or depicted on this site. Such intellectual property remains the property of its respective owners, and any references here are made solely for identification or informational purposes, without implying any affiliation, endorsement, or partnership.
We make no representations or warranties, express or implied, regarding the accuracy, completeness, or suitability of any content or products presented. Nothing on this website should be construed as legal, tax, investment, financial, medical, or other professional advice. In addition, no part of this site—including articles or product references—constitutes a solicitation, recommendation, endorsement, advertisement, or offer to buy or sell any securities, franchises, or other financial instruments, particularly in jurisdictions where such activity would be unlawful.
All content is of a general nature and may not address the specific circumstances of any individual or entity. It is not a substitute for professional advice or services. Any actions you take based on the information provided here are strictly at your own risk. You accept full responsibility for any decisions or outcomes arising from your use of this website and agree to release us from any liability in connection with your use of, or reliance upon, the content or products found herein.