
|
Yongxing Special Materials Technology Co., Ltd (002756.sz) Avaliação DCF |
Totalmente Editável: Adapte-Se Às Suas Necessidades No Excel Ou Planilhas
Design Profissional: Modelos Confiáveis E Padrão Da Indústria
Pré-Construídos Para Uso Rápido E Eficiente
Compatível com MAC/PC, totalmente desbloqueado
Não É Necessária Experiência; Fácil De Seguir
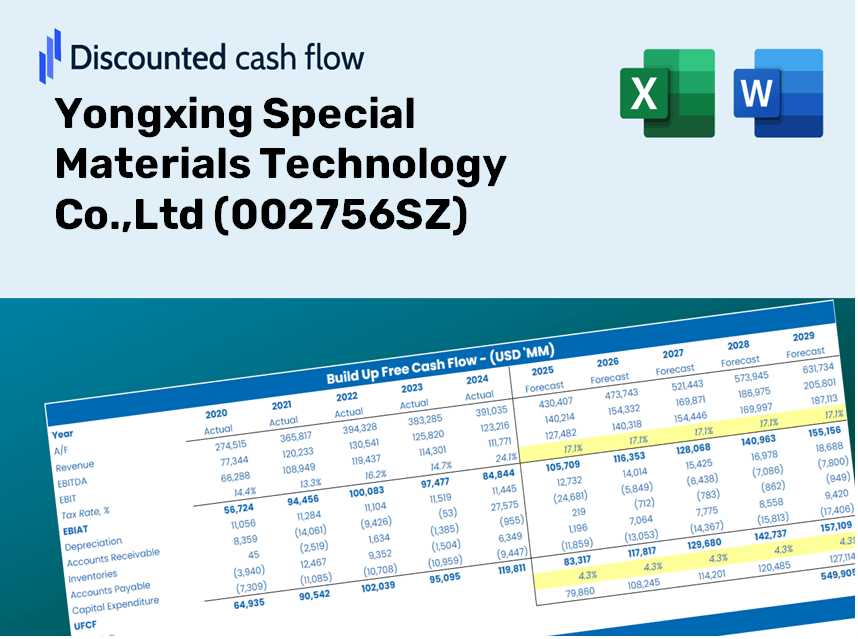
Yongxing Special Materials Technology Co.,Ltd (002756.SZ) Bundle
Avalie o Yongxing Special Materials Technology Co., as perspectivas financeiras da LTD como um especialista! Esta calculadora DCF (002756SZ) fornece dados financeiros pré-preenchidos, juntamente com a completa flexibilidade para modificar o crescimento da receita, WACC, margens e outras suposições essenciais para se alinhar às suas projeções.
Discounted Cash Flow (DCF) - (USD MM)
| Year | AY1 2020 |
AY2 2021 |
AY3 2022 |
AY4 2023 |
AY5 2024 |
FY1 2025 |
FY2 2026 |
FY3 2027 |
FY4 2028 |
FY5 2029 |
|---|---|---|---|---|---|---|---|---|---|---|
| Revenue | 4,973.1 | 7,199.3 | 15,578.7 | 12,189.0 | 8,073.8 | 7,705.8 | 7,354.5 | 7,019.3 | 6,699.3 | 6,393.9 |
| Revenue Growth, % | 0 | 44.76 | 116.39 | -21.76 | -33.76 | -4.56 | -4.56 | -4.56 | -4.56 | -4.56 |
| EBITDA | 390.4 | 1,000.0 | 7,632.7 | 4,122.2 | 1,231.1 | 1,846.3 | 1,762.2 | 1,681.8 | 1,605.2 | 1,532.0 |
| EBITDA, % | 7.85 | 13.89 | 48.99 | 33.82 | 15.25 | 23.96 | 23.96 | 23.96 | 23.96 | 23.96 |
| Depreciation | 135.6 | 165.0 | 208.2 | 278.2 | 286.2 | 187.7 | 179.2 | 171.0 | 163.2 | 155.8 |
| Depreciation, % | 2.73 | 2.29 | 1.34 | 2.28 | 3.54 | 2.44 | 2.44 | 2.44 | 2.44 | 2.44 |
| EBIT | 254.8 | 835.0 | 7,424.5 | 3,844.0 | 944.9 | 1,658.6 | 1,583.0 | 1,510.8 | 1,442.0 | 1,376.2 |
| EBIT, % | 5.12 | 11.6 | 47.66 | 31.54 | 11.7 | 21.52 | 21.52 | 21.52 | 21.52 | 21.52 |
| Total Cash | 1,417.8 | 1,830.2 | 9,026.9 | 9,764.5 | 7,926.0 | 4,471.7 | 4,267.9 | 4,073.3 | 3,887.7 | 3,710.4 |
| Total Cash, percent | .0 | .0 | .0 | .0 | .0 | .0 | .0 | .0 | .0 | .0 |
| Account Receivables | 901.7 | 907.9 | 1,635.7 | 797.6 | 441.2 | 820.7 | 783.3 | 747.6 | 713.5 | 681.0 |
| Account Receivables, % | 18.13 | 12.61 | 10.5 | 6.54 | 5.46 | 10.65 | 10.65 | 10.65 | 10.65 | 10.65 |
| Inventories | 556.8 | 724.2 | 991.0 | 1,095.9 | 752.2 | 707.8 | 675.5 | 644.7 | 615.3 | 587.3 |
| Inventories, % | 11.2 | 10.06 | 6.36 | 8.99 | 9.32 | 9.19 | 9.19 | 9.19 | 9.19 | 9.19 |
| Accounts Payable | 629.4 | 692.7 | 1,116.9 | 881.2 | 848.7 | 727.2 | 694.1 | 662.5 | 632.3 | 603.4 |
| Accounts Payable, % | 12.66 | 9.62 | 7.17 | 7.23 | 10.51 | 9.44 | 9.44 | 9.44 | 9.44 | 9.44 |
| Capital Expenditure | -131.7 | -310.4 | -464.9 | -369.2 | -264.4 | -250.4 | -239.0 | -228.1 | -217.7 | -207.8 |
| Capital Expenditure, % | -2.65 | -4.31 | -2.98 | -3.03 | -3.28 | -3.25 | -3.25 | -3.25 | -3.25 | -3.25 |
| Tax Rate, % | 18.67 | 18.67 | 18.67 | 18.67 | 18.67 | 18.67 | 18.67 | 18.67 | 18.67 | 18.67 |
| EBITAT | 204.7 | 733.3 | 6,122.5 | 3,112.9 | 768.5 | 1,369.8 | 1,307.3 | 1,247.7 | 1,190.9 | 1,136.6 |
| Depreciation | ||||||||||
| Changes in Account Receivables | ||||||||||
| Changes in Inventories | ||||||||||
| Changes in Accounts Payable | ||||||||||
| Capital Expenditure | ||||||||||
| UFCF | -620.5 | 477.6 | 5,295.3 | 3,519.6 | 1,457.7 | 850.6 | 1,284.1 | 1,225.5 | 1,169.7 | 1,116.3 |
| WACC, % | 7.82 | 7.82 | 7.82 | 7.82 | 7.82 | 7.82 | 7.82 | 7.82 | 7.82 | 7.82 |
| PV UFCF | ||||||||||
| SUM PV UFCF | 4,503.2 | |||||||||
| Long Term Growth Rate, % | 0.50 | |||||||||
| Free cash flow (T + 1) | 1,122 | |||||||||
| Terminal Value | 15,334 | |||||||||
| Present Terminal Value | 10,525 | |||||||||
| Enterprise Value | 15,028 | |||||||||
| Net Debt | -6,043 | |||||||||
| Equity Value | 21,071 | |||||||||
| Diluted Shares Outstanding, MM | 530 | |||||||||
| Equity Value Per Share | 39.78 |
Benefits of Choosing Yongxing Special Materials Technology Co., Ltd (002756SZ)
- Comprehensive Financial Model: Utilize Yongxing's actual financials for accurate DCF valuation.
- Complete Forecasting Control: Modify revenue growth, profit margins, WACC, and other essential variables.
- Real-Time Calculations: Automatic updates allow you to view results instantly as adjustments are made.
- Professional-Grade Template: A polished Excel spreadsheet crafted for high-quality valuation presentations.
- Flexible and Reusable: Designed for adaptability, enabling ongoing use for in-depth forecasting.
Key Features
- Authentic Yongxing Financial Data: Access reliable pre-loaded historical figures and future forecasts.
- Adjustable Forecast Parameters: Modify yellow-highlighted fields such as WACC, growth rates, and profit margins.
- Real-Time Calculations: Automatic updates for DCF, Net Present Value (NPV), and cash flow assessments.
- Interactive Visual Dashboard: User-friendly charts and summaries to help you interpret your valuation outcomes.
- Suitable for All Levels: A straightforward, user-friendly layout designed for investors, CFOs, and consultants alike.
How It Operates
- 1. Access the Template: Download and open the Excel file featuring Yongxing Special Materials Technology Co., Ltd’s preloaded data.
- 2. Modify Assumptions: Adjust key parameters such as growth rates, WACC, and capital expenditures.
- 3. Instant Result Evaluation: The DCF model automatically calculates the intrinsic value and NPV in real-time.
- 4. Explore Different Scenarios: Analyze various forecasts to evaluate different valuation results.
- 5. Present with Assurance: Utilize professional valuation insights to bolster your decision-making process.
Why Opt for Yongxing Special Materials Technology Co., Ltd (002756SZ)?
- Time-Saving: Eliminate the hassle of starting from scratch – our tools are immediately available for use.
- Enhanced Accuracy: Dependable financial metrics and methodologies minimize valuation errors.
- Completely Customizable: Adjust the model to align with your specific assumptions and forecasts.
- User-Friendly: Intuitive charts and outputs facilitate straightforward analysis of results.
- Endorsed by Professionals: Created for experts who prioritize both precision and usability.
Who Should Use This Product?
- Investors: Evaluate the valuation of Yongxing Special Materials Technology Co.,Ltd (002756SZ) before making stock transactions.
- CFOs and Financial Analysts: Enhance valuation workflows and validate financial forecasts.
- Startup Founders: Gain insights into how established companies like Yongxing Special Materials Technology Co.,Ltd (002756SZ) are assessed in the market.
- Consultants: Provide comprehensive valuation reports to your clients regarding Yongxing Special Materials Technology Co.,Ltd (002756SZ).
- Students and Educators: Utilize actual data from Yongxing Special Materials Technology Co.,Ltd (002756SZ) to learn and teach valuation methodologies.
Contents of the Template
- Historical Data: Provides Yongxing's previous financials and foundational forecasts.
- DCF and Levered DCF Models: Comprehensive templates designed to calculate Yongxing's intrinsic value.
- WACC Sheet: Pre-configured calculations for the Weighted Average Cost of Capital.
- Editable Inputs: Adjust essential drivers such as growth rates, EBITDA %, and CAPEX assumptions.
- Quarterly and Annual Statements: A thorough analysis of Yongxing's financials.
- Interactive Dashboard: Dynamically visualize valuation results and forecasts.
Disclaimer
All information, articles, and product details provided on this website are for general informational and educational purposes only. We do not claim any ownership over, nor do we intend to infringe upon, any trademarks, copyrights, logos, brand names, or other intellectual property mentioned or depicted on this site. Such intellectual property remains the property of its respective owners, and any references here are made solely for identification or informational purposes, without implying any affiliation, endorsement, or partnership.
We make no representations or warranties, express or implied, regarding the accuracy, completeness, or suitability of any content or products presented. Nothing on this website should be construed as legal, tax, investment, financial, medical, or other professional advice. In addition, no part of this site—including articles or product references—constitutes a solicitation, recommendation, endorsement, advertisement, or offer to buy or sell any securities, franchises, or other financial instruments, particularly in jurisdictions where such activity would be unlawful.
All content is of a general nature and may not address the specific circumstances of any individual or entity. It is not a substitute for professional advice or services. Any actions you take based on the information provided here are strictly at your own risk. You accept full responsibility for any decisions or outcomes arising from your use of this website and agree to release us from any liability in connection with your use of, or reliance upon, the content or products found herein.