
|
Tonze New Energy Technology Co., Ltd. (002759.SZ) Avaliação DCF |
Totalmente Editável: Adapte-Se Às Suas Necessidades No Excel Ou Planilhas
Design Profissional: Modelos Confiáveis E Padrão Da Indústria
Pré-Construídos Para Uso Rápido E Eficiente
Compatível com MAC/PC, totalmente desbloqueado
Não É Necessária Experiência; Fácil De Seguir
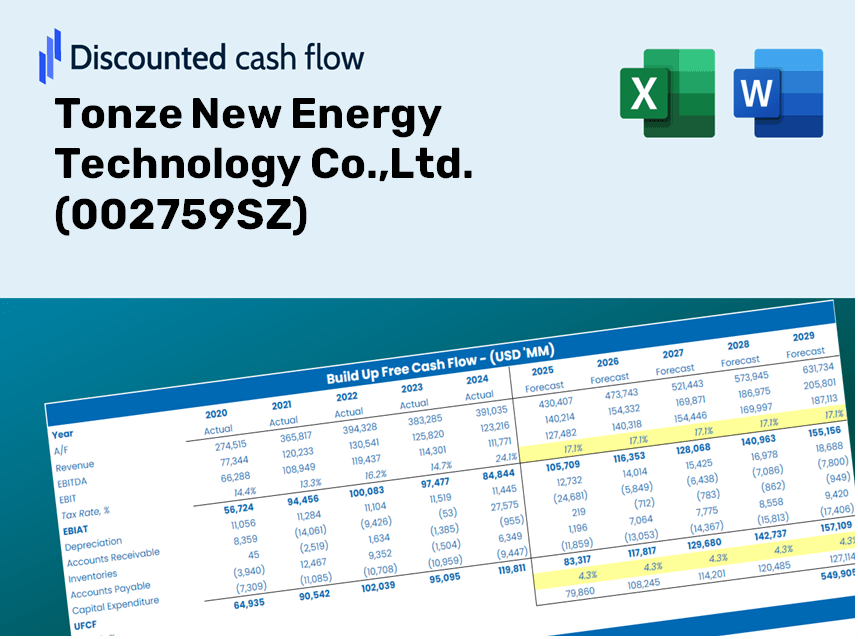
Tonze New Energy Technology Co.,Ltd. (002759.SZ) Bundle
Explore as perspectivas financeiras da Tonze New Energy Technology Co., Ltd. (002759SZ) com nossa calculadora DCF amigável! Digite suas projeções de crescimento, margens de lucro e despesas para calcular o valor intrínseco da Tonze New Energy Technology Co., Ltd. (002759SZ) e molde sua abordagem de investimento.
Discounted Cash Flow (DCF) - (USD MM)
| Year | AY1 2020 |
AY2 2021 |
AY3 2022 |
AY4 2023 |
AY5 2024 |
FY1 2025 |
FY2 2026 |
FY3 2027 |
FY4 2028 |
FY5 2029 |
|---|---|---|---|---|---|---|---|---|---|---|
| Revenue | 742.8 | 2,252.6 | 3,274.6 | 2,193.0 | 2,054.5 | 2,040.6 | 2,026.7 | 2,013.0 | 1,999.3 | 1,985.7 |
| Revenue Growth, % | 0 | 203.24 | 45.37 | -33.03 | -6.32 | -0.67879 | -0.67879 | -0.67879 | -0.67879 | -0.67879 |
| EBITDA | 74.5 | 943.8 | 706.2 | 172.7 | -221.6 | 288.1 | 286.1 | 284.2 | 282.3 | 280.3 |
| EBITDA, % | 10.03 | 41.9 | 21.57 | 7.88 | -10.79 | 14.12 | 14.12 | 14.12 | 14.12 | 14.12 |
| Depreciation | 59.3 | 59.4 | 87.0 | 123.8 | 159.4 | 108.9 | 108.1 | 107.4 | 106.7 | 105.9 |
| Depreciation, % | 7.98 | 2.64 | 2.66 | 5.64 | 7.76 | 5.34 | 5.34 | 5.34 | 5.34 | 5.34 |
| EBIT | 15.3 | 884.4 | 619.2 | 48.9 | -381.0 | 179.2 | 178.0 | 176.8 | 175.6 | 174.4 |
| EBIT, % | 2.06 | 39.26 | 18.91 | 2.23 | -18.55 | 8.78 | 8.78 | 8.78 | 8.78 | 8.78 |
| Total Cash | 64.4 | 505.3 | 1,028.8 | 1,918.9 | 1,092.0 | 829.2 | 823.5 | 817.9 | 812.4 | 806.9 |
| Total Cash, percent | .0 | .0 | .0 | .0 | .0 | .0 | .0 | .0 | .0 | .0 |
| Account Receivables | 636.3 | 1,015.8 | 1,357.2 | 1,010.5 | 953.8 | 1,080.3 | 1,073.0 | 1,065.7 | 1,058.4 | 1,051.3 |
| Account Receivables, % | 85.66 | 45.09 | 41.45 | 46.08 | 46.42 | 52.94 | 52.94 | 52.94 | 52.94 | 52.94 |
| Inventories | 106.4 | 189.8 | 431.2 | 384.8 | 326.5 | 283.0 | 281.1 | 279.2 | 277.3 | 275.4 |
| Inventories, % | 14.32 | 8.42 | 13.17 | 17.54 | 15.89 | 13.87 | 13.87 | 13.87 | 13.87 | 13.87 |
| Accounts Payable | 111.3 | 343.7 | 1,556.5 | 1,508.9 | 1,530.4 | 902.2 | 896.1 | 890.0 | 884.0 | 878.0 |
| Accounts Payable, % | 14.99 | 15.26 | 47.53 | 68.8 | 74.49 | 44.21 | 44.21 | 44.21 | 44.21 | 44.21 |
| Capital Expenditure | -36.7 | -177.1 | -438.9 | -257.3 | -649.2 | -283.8 | -281.9 | -279.9 | -278.0 | -276.2 |
| Capital Expenditure, % | -4.94 | -7.86 | -13.4 | -11.73 | -31.6 | -13.91 | -13.91 | -13.91 | -13.91 | -13.91 |
| Tax Rate, % | 5.36 | 5.36 | 5.36 | 5.36 | 5.36 | 5.36 | 5.36 | 5.36 | 5.36 | 5.36 |
| EBITAT | 23.3 | 743.1 | 531.7 | 34.9 | -360.6 | 156.2 | 155.2 | 154.1 | 153.1 | 152.0 |
| Depreciation | ||||||||||
| Changes in Account Receivables | ||||||||||
| Changes in Inventories | ||||||||||
| Changes in Accounts Payable | ||||||||||
| Capital Expenditure | ||||||||||
| UFCF | -585.5 | 394.9 | 809.8 | 246.9 | -713.8 | -729.9 | -15.4 | -15.3 | -15.2 | -15.1 |
| WACC, % | 9.25 | 9.22 | 9.22 | 9.19 | 9.24 | 9.22 | 9.22 | 9.22 | 9.22 | 9.22 |
| PV UFCF | ||||||||||
| SUM PV UFCF | -713.5 | |||||||||
| Long Term Growth Rate, % | 2.00 | |||||||||
| Free cash flow (T + 1) | -15 | |||||||||
| Terminal Value | -214 | |||||||||
| Present Terminal Value | -137 | |||||||||
| Enterprise Value | -851 | |||||||||
| Net Debt | -285 | |||||||||
| Equity Value | -566 | |||||||||
| Diluted Shares Outstanding, MM | 502 | |||||||||
| Equity Value Per Share | -1.13 |
What You Will Gain
- Authentic Tonze Data: Preloaded financial metrics – including revenue and EBIT – derived from actual and projected figures.
- Comprehensive Customization: Modify key parameters (yellow cells) such as WACC, growth %, and tax rates to suit your analysis.
- Instant Valuation Adjustments: Automatic updates for quick reassessments of Tonze’s fair value in response to changes.
- Flexible Excel Template: Designed for easy modifications, scenario evaluations, and in-depth forecasting.
- Efficient and Precise: Bypass the complexities of building models from the ground up while ensuring accuracy and adaptability.
Key Features
- Pre-Loaded Data: Tonze New Energy’s historical financial statements and pre-filled projections.
- Fully Customizable Inputs: Adjust WACC, tax rates, revenue growth, and EBITDA margins as needed.
- Real-Time Results: Observe the recalculation of Tonze New Energy’s intrinsic value instantly.
- Intuitive Visual Outputs: Dashboard charts showcase valuation results and essential metrics.
- Designed for Precision: A professional-grade tool tailored for analysts, investors, and finance professionals.
How It Functions
- Step 1: Download the Excel spreadsheet.
- Step 2: Examine the pre-filled data for Tonze New Energy Technology Co., Ltd. (002759SZ).
- Step 3: Modify the key assumptions (highlighted in yellow) according to your analysis.
- Step 4: Observe the automatic recalculations for Tonze's intrinsic value.
- Step 5: Utilize the results for making investment decisions or for reporting purposes.
Why Choose This Calculator for Tonze New Energy Technology Co., Ltd. (002759SZ)?
- Reliable Figures: Utilize authentic financial data from Tonze New Energy for trustworthy valuation outcomes.
- Adjustable Settings: Tailor essential metrics such as growth rates, WACC, and tax rates to fit your forecasts.
- Efficiency Boost: Built-in calculations save you the time of starting from the beginning.
- Expert-Quality Tool: Perfectly crafted for investors, analysts, and consultants in the energy sector.
- Easy to Use: With its clear interface and guided steps, this tool is accessible for users of all experience levels.
Who Can Benefit from This Product?
- Investors: Evaluate Tonze New Energy Technology Co.,Ltd.'s (002759SZ) valuation before making stock transactions.
- CFOs and Financial Analysts: Enhance valuation processes and assess projections effectively.
- Startup Founders: Discover how leading public companies like Tonze New Energy are appraised.
- Consultants: Produce detailed valuation reports for your clientele.
- Students and Educators: Utilize real-time data to practice and instruct valuation methodologies.
Contents of the Template
- Preloaded Tonze Data: Historical and forecasted financial metrics, including revenue, EBIT, and capital expenditures.
- DCF and WACC Models: Advanced worksheets for deriving intrinsic value and calculating the Weighted Average Cost of Capital.
- Customizable Inputs: Yellow-highlighted cells for modifying revenue growth, tax rates, and discount rates.
- Financial Statements: Detailed annual and quarterly financial reports for thorough analysis.
- Key Ratios: Ratios for profitability, leverage, and efficiency to assess performance.
- Dashboard and Visuals: Graphical representations of valuation results and underlying assumptions.
Disclaimer
All information, articles, and product details provided on this website are for general informational and educational purposes only. We do not claim any ownership over, nor do we intend to infringe upon, any trademarks, copyrights, logos, brand names, or other intellectual property mentioned or depicted on this site. Such intellectual property remains the property of its respective owners, and any references here are made solely for identification or informational purposes, without implying any affiliation, endorsement, or partnership.
We make no representations or warranties, express or implied, regarding the accuracy, completeness, or suitability of any content or products presented. Nothing on this website should be construed as legal, tax, investment, financial, medical, or other professional advice. In addition, no part of this site—including articles or product references—constitutes a solicitation, recommendation, endorsement, advertisement, or offer to buy or sell any securities, franchises, or other financial instruments, particularly in jurisdictions where such activity would be unlawful.
All content is of a general nature and may not address the specific circumstances of any individual or entity. It is not a substitute for professional advice or services. Any actions you take based on the information provided here are strictly at your own risk. You accept full responsibility for any decisions or outcomes arising from your use of this website and agree to release us from any liability in connection with your use of, or reliance upon, the content or products found herein.