
|
Landai Technology Group Corp., Ltd. (002765.sz) Avaliação DCF |
Totalmente Editável: Adapte-Se Às Suas Necessidades No Excel Ou Planilhas
Design Profissional: Modelos Confiáveis E Padrão Da Indústria
Pré-Construídos Para Uso Rápido E Eficiente
Compatível com MAC/PC, totalmente desbloqueado
Não É Necessária Experiência; Fácil De Seguir
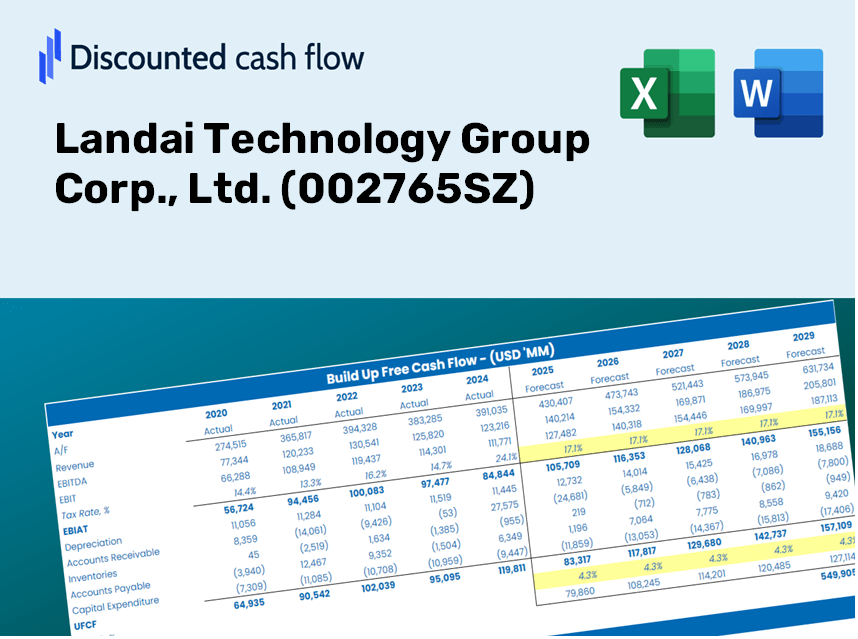
Landai Technology Group Corp., Ltd. (002765.SZ) Bundle
Como investidor ou analista, a calculadora DCF da Landai Technology Group Corp., Ltd. (002765SZ) é uma ferramenta essencial para uma avaliação precisa. Carregado com dados reais da tecnologia Landai, você pode ajustar facilmente as previsões e observar os efeitos em tempo real.
Discounted Cash Flow (DCF) - (USD MM)
| Year | AY1 2020 |
AY2 2021 |
AY3 2022 |
AY4 2023 |
AY5 2024 |
FY1 2025 |
FY2 2026 |
FY3 2027 |
FY4 2028 |
FY5 2029 |
|---|---|---|---|---|---|---|---|---|---|---|
| Revenue | 2,409.5 | 3,139.5 | 2,873.5 | 2,807.7 | 3,535.8 | 3,937.7 | 4,385.4 | 4,883.9 | 5,439.0 | 6,057.3 |
| Revenue Growth, % | 0 | 30.3 | -8.47 | -2.29 | 25.93 | 11.37 | 11.37 | 11.37 | 11.37 | 11.37 |
| EBITDA | 125.8 | 367.5 | 312.5 | 110.6 | 332.3 | 324.0 | 360.8 | 401.8 | 447.5 | 498.4 |
| EBITDA, % | 5.22 | 11.71 | 10.87 | 3.94 | 9.4 | 8.23 | 8.23 | 8.23 | 8.23 | 8.23 |
| Depreciation | 151.5 | 157.7 | 153.6 | 174.4 | 230.1 | 231.4 | 257.7 | 287.0 | 319.6 | 355.9 |
| Depreciation, % | 6.29 | 5.02 | 5.35 | 6.21 | 6.51 | 5.88 | 5.88 | 5.88 | 5.88 | 5.88 |
| EBIT | -25.7 | 209.8 | 158.8 | -63.9 | 102.2 | 92.6 | 103.1 | 114.9 | 127.9 | 142.5 |
| EBIT, % | -1.06 | 6.68 | 5.53 | -2.27 | 2.89 | 2.35 | 2.35 | 2.35 | 2.35 | 2.35 |
| Total Cash | 453.5 | 506.8 | 652.7 | 675.4 | 710.2 | 801.9 | 893.0 | 994.5 | 1,107.6 | 1,233.5 |
| Total Cash, percent | .0 | .0 | .0 | .0 | .0 | .0 | .0 | .0 | .0 | .0 |
| Account Receivables | 713.9 | 1,050.1 | 870.2 | 941.0 | 1,280.7 | 1,284.5 | 1,430.5 | 1,593.1 | 1,774.2 | 1,975.9 |
| Account Receivables, % | 29.63 | 33.45 | 30.28 | 33.51 | 36.22 | 32.62 | 32.62 | 32.62 | 32.62 | 32.62 |
| Inventories | 546.2 | 736.7 | 646.3 | 759.7 | 730.7 | 916.3 | 1,020.5 | 1,136.5 | 1,265.7 | 1,409.5 |
| Inventories, % | 22.67 | 23.47 | 22.49 | 27.06 | 20.67 | 23.27 | 23.27 | 23.27 | 23.27 | 23.27 |
| Accounts Payable | 843.1 | 1,003.0 | 933.9 | 1,319.4 | 1,399.7 | 1,465.0 | 1,631.5 | 1,817.0 | 2,023.5 | 2,253.5 |
| Accounts Payable, % | 34.99 | 31.95 | 32.5 | 46.99 | 39.59 | 37.2 | 37.2 | 37.2 | 37.2 | 37.2 |
| Capital Expenditure | -112.2 | -86.9 | -454.9 | -557.6 | -408.9 | -430.6 | -479.6 | -534.1 | -594.8 | -662.4 |
| Capital Expenditure, % | -4.66 | -2.77 | -15.83 | -19.86 | -11.57 | -10.94 | -10.94 | -10.94 | -10.94 | -10.94 |
| Tax Rate, % | 6.88 | 6.88 | 6.88 | 6.88 | 6.88 | 6.88 | 6.88 | 6.88 | 6.88 | 6.88 |
| EBITAT | 5.3 | 168.6 | 131.0 | -60.8 | 95.1 | 65.1 | 72.4 | 80.7 | 89.9 | 100.1 |
| Depreciation | ||||||||||
| Changes in Account Receivables | ||||||||||
| Changes in Inventories | ||||||||||
| Changes in Accounts Payable | ||||||||||
| Capital Expenditure | ||||||||||
| UFCF | -372.4 | -127.4 | 31.0 | -242.8 | -314.0 | -258.3 | -233.1 | -259.6 | -289.1 | -322.0 |
| WACC, % | 4.17 | 4.4 | 4.41 | 4.44 | 4.44 | 4.37 | 4.37 | 4.37 | 4.37 | 4.37 |
| PV UFCF | ||||||||||
| SUM PV UFCF | -1,193.5 | |||||||||
| Long Term Growth Rate, % | 3.00 | |||||||||
| Free cash flow (T + 1) | -332 | |||||||||
| Terminal Value | -24,204 | |||||||||
| Present Terminal Value | -19,543 | |||||||||
| Enterprise Value | -20,737 | |||||||||
| Net Debt | 64 | |||||||||
| Equity Value | -20,801 | |||||||||
| Diluted Shares Outstanding, MM | 652 | |||||||||
| Equity Value Per Share | -31.90 |
Benefits You Will Receive
- Authentic Landai Data: Pre-filled financial metrics – covering everything from revenue to EBIT – based on real and forecasted data.
- Complete Customization: Modify all essential parameters (yellow cells) such as WACC, growth rates, and tax percentages.
- Instant Valuation Refresh: Automatic updates to evaluate the effects of changes on Landai Technology Group's fair value.
- Flexible Excel Template: Designed for quick modifications, scenario analysis, and comprehensive forecasts.
- Efficient and Precise: Avoid the hassle of building models from the ground up while ensuring accuracy and adaptability.
Key Features
- Real-Time Landai Data: Pre-loaded with Landai Technology Group Corp.'s historical performance metrics and future forecasts.
- Customizable Input Options: Modify projections for revenue growth, profit margins, discount rates, tax implications, and capital investments.
- Interactive Valuation Model: Automatic recalculations of Net Present Value (NPV) and intrinsic worth based on your adjustments.
- Scenario Analysis: Develop multiple forecasting scenarios to explore various valuation results.
- Intuitive User Interface: Designed for ease of use, making it suitable for both industry experts and newcomers.
How It Works
- Step 1: Download the prebuilt Excel template that includes Landai Technology Group's data.
- Step 2: Navigate through the pre-filled sheets to familiarize yourself with the essential metrics.
- Step 3: Modify forecasts and assumptions in the editable yellow cells (WACC, growth, margins).
- Step 4: View the recalculated results instantly, including Landai Technology Group's intrinsic value.
- Step 5: Use the outputs to make informed investment decisions or create detailed reports.
Why Opt for This Calculator?
- Precise Data: Utilize authentic financial metrics from Landai Technology Group Corp., Ltd. ([002765SZ]) for dependable valuation results.
- Flexible Settings: Tailor crucial variables such as growth projections, WACC, and tax rates to align with your analysis.
- Efficiency Boost: Pre-configured calculations save you the hassle of building from the ground up.
- Premium Quality Tool: Crafted for investors, analysts, and consultants in mind.
- Easy to Use: Featuring a user-friendly design and straightforward instructions, suitable for all levels of experience.
Who Can Benefit from This Product?
- Individual Investors: Gain the insights necessary for making informed decisions regarding Landai Technology Group Corp., Ltd. (002765SZ) stock.
- Financial Analysts: Enhance valuation tasks with ready-to-use financial models tailored for Landai Technology Group Corp., Ltd. (002765SZ).
- Consultants: Provide clients with accurate and timely valuation insights for Landai Technology Group Corp., Ltd. (002765SZ).
- Business Owners: Learn how major companies like Landai Technology Group Corp., Ltd. (002765SZ) are valued to inform your own business strategy.
- Finance Students: Master valuation techniques using the real-world data and scenarios associated with Landai Technology Group Corp., Ltd. (002765SZ).
Contents of the Template
- Preloaded LTGC Data: Historical and projected financial metrics, including revenue, EBIT, and capital expenditures.
- DCF and WACC Models: Advanced spreadsheets designed for calculating intrinsic value and the Weighted Average Cost of Capital.
- Editable Inputs: Cells highlighted in yellow for customizing revenue growth, tax rates, and discount rates.
- Financial Statements: Detailed annual and quarterly financial statements for thorough analysis.
- Key Ratios: Ratios assessing profitability, leverage, and efficiency to gauge performance.
- Dashboard and Charts: Visual representations of valuation results and underlying assumptions.
Disclaimer
All information, articles, and product details provided on this website are for general informational and educational purposes only. We do not claim any ownership over, nor do we intend to infringe upon, any trademarks, copyrights, logos, brand names, or other intellectual property mentioned or depicted on this site. Such intellectual property remains the property of its respective owners, and any references here are made solely for identification or informational purposes, without implying any affiliation, endorsement, or partnership.
We make no representations or warranties, express or implied, regarding the accuracy, completeness, or suitability of any content or products presented. Nothing on this website should be construed as legal, tax, investment, financial, medical, or other professional advice. In addition, no part of this site—including articles or product references—constitutes a solicitation, recommendation, endorsement, advertisement, or offer to buy or sell any securities, franchises, or other financial instruments, particularly in jurisdictions where such activity would be unlawful.
All content is of a general nature and may not address the specific circumstances of any individual or entity. It is not a substitute for professional advice or services. Any actions you take based on the information provided here are strictly at your own risk. You accept full responsibility for any decisions or outcomes arising from your use of this website and agree to release us from any liability in connection with your use of, or reliance upon, the content or products found herein.