
|
Guangdong Kinlong Hardware Products Co., Ltd. (002791.sz) Avaliação do DCF |
Totalmente Editável: Adapte-Se Às Suas Necessidades No Excel Ou Planilhas
Design Profissional: Modelos Confiáveis E Padrão Da Indústria
Pré-Construídos Para Uso Rápido E Eficiente
Compatível com MAC/PC, totalmente desbloqueado
Não É Necessária Experiência; Fácil De Seguir
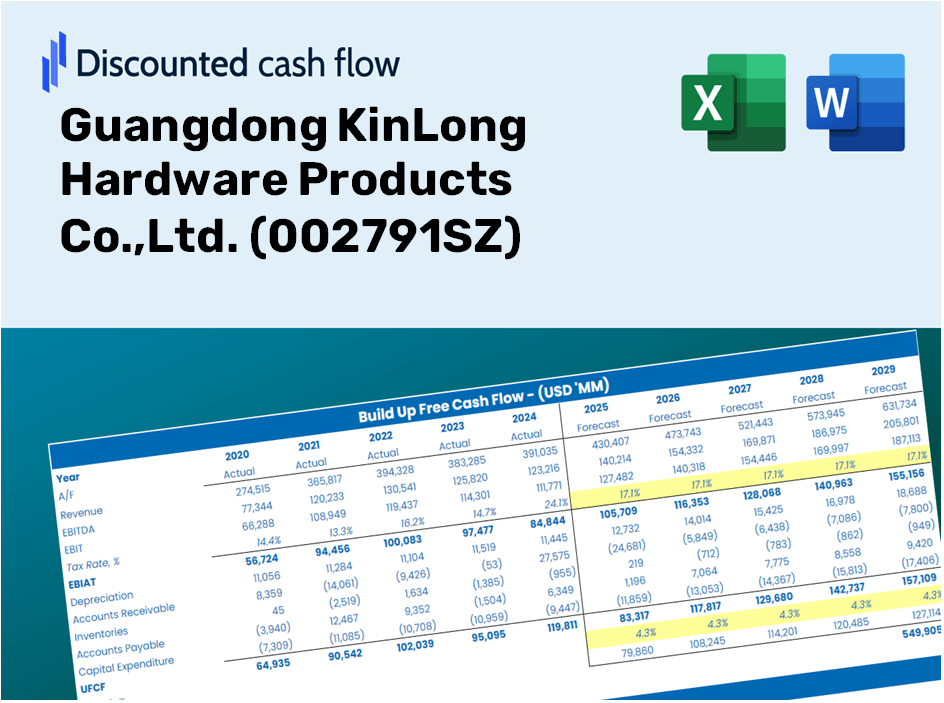
Guangdong KinLong Hardware Products Co.,Ltd. (002791.SZ) Bundle
Projetado para precisão, a nossa calculadora DCF (002791SZ) o capacita a avaliar a avaliação da Guangdong Kinlong Hardware Products Co., Ltd. usando dados financeiros reais, oferecendo flexibilidade completa para modificar todos os parâmetros essenciais para projeções aprimoradas.
Discounted Cash Flow (DCF) - (USD MM)
| Year | AY1 2020 |
AY2 2021 |
AY3 2022 |
AY4 2023 |
AY5 2024 |
FY1 2025 |
FY2 2026 |
FY3 2027 |
FY4 2028 |
FY5 2029 |
|---|---|---|---|---|---|---|---|---|---|---|
| Revenue | 6,737.0 | 8,806.8 | 7,648.3 | 7,801.5 | 6,637.6 | 6,714.8 | 6,792.9 | 6,871.9 | 6,951.8 | 7,032.6 |
| Revenue Growth, % | 0 | 30.72 | -13.16 | 2 | -14.92 | 1.16 | 1.16 | 1.16 | 1.16 | 1.16 |
| EBITDA | 1,102.5 | 1,279.4 | 290.7 | 565.8 | 292.9 | 622.6 | 629.8 | 637.1 | 644.5 | 652.0 |
| EBITDA, % | 16.36 | 14.53 | 3.8 | 7.25 | 4.41 | 9.27 | 9.27 | 9.27 | 9.27 | 9.27 |
| Depreciation | 110.6 | 129.8 | 145.3 | 148.9 | 144.4 | 122.2 | 123.6 | 125.1 | 126.5 | 128.0 |
| Depreciation, % | 1.64 | 1.47 | 1.9 | 1.91 | 2.18 | 1.82 | 1.82 | 1.82 | 1.82 | 1.82 |
| EBIT | 991.9 | 1,149.6 | 145.4 | 416.9 | 148.5 | 500.3 | 506.2 | 512.1 | 518.0 | 524.0 |
| EBIT, % | 14.72 | 13.05 | 1.9 | 5.34 | 2.24 | 7.45 | 7.45 | 7.45 | 7.45 | 7.45 |
| Total Cash | 1,394.8 | 1,673.8 | 1,883.0 | 1,409.2 | 1,466.5 | 1,403.2 | 1,419.5 | 1,436.0 | 1,452.7 | 1,469.6 |
| Total Cash, percent | .0 | .0 | .0 | .0 | .0 | .0 | .0 | .0 | .0 | .0 |
| Account Receivables | 2,786.9 | 4,760.7 | 4,536.9 | 4,159.8 | 3,664.4 | 3,535.6 | 3,576.7 | 3,618.3 | 3,660.4 | 3,703.0 |
| Account Receivables, % | 41.37 | 54.06 | 59.32 | 53.32 | 55.21 | 52.65 | 52.65 | 52.65 | 52.65 | 52.65 |
| Inventories | 1,034.8 | 1,255.0 | 1,310.7 | 1,337.1 | 1,300.9 | 1,121.2 | 1,134.2 | 1,147.4 | 1,160.7 | 1,174.2 |
| Inventories, % | 15.36 | 14.25 | 17.14 | 17.14 | 19.6 | 16.7 | 16.7 | 16.7 | 16.7 | 16.7 |
| Accounts Payable | 1,560.3 | 3,106.1 | 3,567.7 | 2,906.1 | 1,412.0 | 2,197.1 | 2,222.6 | 2,248.5 | 2,274.6 | 2,301.1 |
| Accounts Payable, % | 23.16 | 35.27 | 46.65 | 37.25 | 21.27 | 32.72 | 32.72 | 32.72 | 32.72 | 32.72 |
| Capital Expenditure | -305.7 | -431.5 | -455.9 | -344.1 | -340.0 | -334.8 | -338.7 | -342.7 | -346.6 | -350.7 |
| Capital Expenditure, % | -4.54 | -4.9 | -5.96 | -4.41 | -5.12 | -4.99 | -4.99 | -4.99 | -4.99 | -4.99 |
| Tax Rate, % | 24.43 | 24.43 | 24.43 | 24.43 | 24.43 | 24.43 | 24.43 | 24.43 | 24.43 | 24.43 |
| EBITAT | 818.4 | 910.8 | 98.8 | 329.7 | 112.2 | 384.6 | 389.1 | 393.6 | 398.2 | 402.8 |
| Depreciation | ||||||||||
| Changes in Account Receivables | ||||||||||
| Changes in Inventories | ||||||||||
| Changes in Accounts Payable | ||||||||||
| Capital Expenditure | ||||||||||
| UFCF | -1,638.1 | -39.2 | 417.9 | -176.4 | -1,045.9 | 1,265.6 | 145.4 | 147.1 | 148.8 | 150.5 |
| WACC, % | 6.93 | 6.93 | 6.91 | 6.93 | 6.92 | 6.92 | 6.92 | 6.92 | 6.92 | 6.92 |
| PV UFCF | ||||||||||
| SUM PV UFCF | 1,652.7 | |||||||||
| Long Term Growth Rate, % | 4.00 | |||||||||
| Free cash flow (T + 1) | 157 | |||||||||
| Terminal Value | 5,355 | |||||||||
| Present Terminal Value | 3,831 | |||||||||
| Enterprise Value | 5,484 | |||||||||
| Net Debt | -892 | |||||||||
| Equity Value | 6,376 | |||||||||
| Diluted Shares Outstanding, MM | 330 | |||||||||
| Equity Value Per Share | 19.32 |
What You Will Receive
- Adjustable Projection Inputs: Effortlessly modify key assumptions (growth %, margins, WACC) to formulate various scenarios.
- Comprehensive Market Data: Pre-loaded financial information for Guangdong KinLong Hardware Products Co., Ltd. ([002791SZ]) to aid your analysis.
- Automated DCF Calculations: The template seamlessly computes Net Present Value (NPV) and intrinsic value for you.
- Tailored and Professional Design: A refined Excel model that can be customized to suit your valuation requirements.
- Designed for Analysts and Investors: Perfect for evaluating forecasts, confirming strategies, and enhancing efficiency.
Core Attributes
- Customizable Financial Inputs: Adjust essential metrics such as revenue growth, EBITDA percentage, and capital expenditures.
- Instant DCF Valuation: Quickly computes intrinsic value, net present value (NPV), and other key financial indicators.
- High-Precision Accuracy: Leverages Guangdong KinLong's actual financial data for dependable valuation results.
- Simplified Scenario Analysis: Effortlessly explore various assumptions and assess their impact on outcomes.
- Efficiency Booster: Streamlines the valuation process, eliminating the necessity to construct intricate models from the ground up.
How It Works
- Step 1: Download the prebuilt Excel template featuring Guangdong KinLong Hardware Products Co., Ltd.'s (002791SZ) data.
- Step 2: Navigate through the pre-filled sheets to familiarize yourself with the essential metrics.
- Step 3: Modify forecasts and assumptions in the editable yellow cells (WACC, growth, margins).
- Step 4: Instantly view the updated results, including the intrinsic value of Guangdong KinLong Hardware Products Co., Ltd. (002791SZ).
- Step 5: Utilize the outputs to make informed investment decisions or create detailed reports.
Why Opt for Our Financial Calculator?
- All-in-One Solution: Provides DCF, WACC, and financial ratio analyses in a single platform.
- Adjustable Parameters: Modify the yellow-highlighted fields to explore different scenarios.
- In-Depth Analysis: Automatically computes the intrinsic value and Net Present Value for Guangdong KinLong Hardware Products Co., Ltd. (002791SZ).
- Ready-to-Use Data: Includes historical and projected data for reliable starting figures.
- High-Quality Standards: Perfect for financial analysts, investors, and business advisors.
Who Can Benefit from This Product?
- Investors: Evaluate Guangdong KinLong Hardware Products Co.,Ltd.'s (002791SZ) market position before making investment decisions.
- CFOs and Financial Analysts: Enhance valuation methods and validate financial forecasts.
- Startup Founders: Discover how established companies like Guangdong KinLong (002791SZ) determine their value.
- Consultants: Provide accurate valuation reports to assist clients in their investment strategies.
- Students and Educators: Utilize real-time data to practice and teach valuation principles effectively.
What the Template Includes
- Preloaded KinLong Data: Historical and projected financial metrics, such as revenue, EBIT, and capital expenditures.
- DCF and WACC Models: Expert-level spreadsheets for assessing intrinsic value and calculating the Weighted Average Cost of Capital.
- Editable Inputs: Cells highlighted in yellow for modifying revenue growth, tax rates, and discount rates.
- Financial Statements: Detailed annual and quarterly financial reports for in-depth analysis.
- Key Ratios: Analysis of profitability, leverage, and efficiency ratios for performance evaluation.
- Dashboard and Charts: Visual representations of valuation results and underlying assumptions.
Disclaimer
All information, articles, and product details provided on this website are for general informational and educational purposes only. We do not claim any ownership over, nor do we intend to infringe upon, any trademarks, copyrights, logos, brand names, or other intellectual property mentioned or depicted on this site. Such intellectual property remains the property of its respective owners, and any references here are made solely for identification or informational purposes, without implying any affiliation, endorsement, or partnership.
We make no representations or warranties, express or implied, regarding the accuracy, completeness, or suitability of any content or products presented. Nothing on this website should be construed as legal, tax, investment, financial, medical, or other professional advice. In addition, no part of this site—including articles or product references—constitutes a solicitation, recommendation, endorsement, advertisement, or offer to buy or sell any securities, franchises, or other financial instruments, particularly in jurisdictions where such activity would be unlawful.
All content is of a general nature and may not address the specific circumstances of any individual or entity. It is not a substitute for professional advice or services. Any actions you take based on the information provided here are strictly at your own risk. You accept full responsibility for any decisions or outcomes arising from your use of this website and agree to release us from any liability in connection with your use of, or reliance upon, the content or products found herein.