
|
Guangzhou Shiyuan Electronic Technology Company Limited (002841.sz) Avaliação DCF |
Totalmente Editável: Adapte-Se Às Suas Necessidades No Excel Ou Planilhas
Design Profissional: Modelos Confiáveis E Padrão Da Indústria
Pré-Construídos Para Uso Rápido E Eficiente
Compatível com MAC/PC, totalmente desbloqueado
Não É Necessária Experiência; Fácil De Seguir
Guangzhou Shiyuan Electronic Technology Company Limited (002841.SZ) Bundle
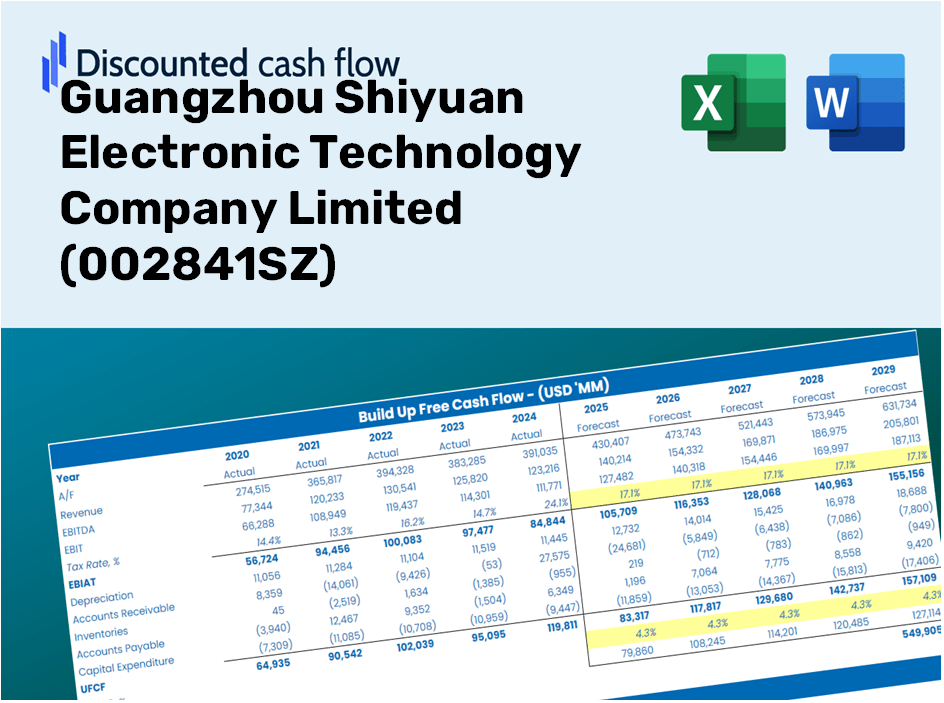
Simplifique a avaliação de Guangzhou Shiyuan Electronic Technology Company Limited (002841SZ) com esta calculadora DCF personalizável! Apresentando o Real Guangzhou Shiyuan Electronic Technology Company Limited (002841SZ) e insumos de previsão ajustáveis, você pode testar cenários e descobrir o valor justo Guangzhou Shiyuan Electronic Technology Limited (002841SZ) em minutos.
Discounted Cash Flow (DCF) - (USD MM)
| Year | AY1 2020 |
AY2 2021 |
AY3 2022 |
AY4 2023 |
AY5 2024 |
FY1 2025 |
FY2 2026 |
FY3 2027 |
FY4 2028 |
FY5 2029 |
|---|---|---|---|---|---|---|---|---|---|---|
| Revenue | 17,129.3 | 21,225.7 | 20,990.3 | 20,172.6 | 22,401.2 | 24,078.9 | 25,882.2 | 27,820.6 | 29,904.2 | 32,143.9 |
| Revenue Growth, % | 0 | 23.91 | -1.11 | -3.9 | 11.05 | 7.49 | 7.49 | 7.49 | 7.49 | 7.49 |
| EBITDA | 1,939.3 | 1,684.3 | 2,048.5 | 1,311.7 | 1,028.2 | 1,931.5 | 2,076.2 | 2,231.7 | 2,398.8 | 2,578.5 |
| EBITDA, % | 11.32 | 7.94 | 9.76 | 6.5 | 4.59 | 8.02 | 8.02 | 8.02 | 8.02 | 8.02 |
| Depreciation | 131.5 | 168.8 | 176.7 | 216.8 | 281.7 | 228.1 | 245.2 | 263.6 | 283.3 | 304.5 |
| Depreciation, % | 0.76771 | 0.79518 | 0.84179 | 1.07 | 1.26 | 0.94733 | 0.94733 | 0.94733 | 0.94733 | 0.94733 |
| EBIT | 1,807.8 | 1,515.6 | 1,871.8 | 1,095.0 | 746.5 | 1,703.4 | 1,831.0 | 1,968.1 | 2,115.5 | 2,274.0 |
| EBIT, % | 10.55 | 7.14 | 8.92 | 5.43 | 3.33 | 7.07 | 7.07 | 7.07 | 7.07 | 7.07 |
| Total Cash | 4,275.7 | 5,021.6 | 5,560.0 | 10,024.1 | 5,214.1 | 7,131.0 | 7,665.1 | 8,239.1 | 8,856.2 | 9,519.5 |
| Total Cash, percent | .0 | .0 | .0 | .0 | .0 | .0 | .0 | .0 | .0 | .0 |
| Account Receivables | 624.3 | 431.8 | 480.0 | 505.7 | 612.8 | 636.1 | 683.7 | 734.9 | 789.9 | 849.1 |
| Account Receivables, % | 3.64 | 2.03 | 2.29 | 2.51 | 2.74 | 2.64 | 2.64 | 2.64 | 2.64 | 2.64 |
| Inventories | 1,828.7 | 2,382.5 | 1,857.1 | 2,238.3 | 2,314.8 | 2,512.7 | 2,700.9 | 2,903.2 | 3,120.6 | 3,354.3 |
| Inventories, % | 10.68 | 11.22 | 8.85 | 11.1 | 10.33 | 10.44 | 10.44 | 10.44 | 10.44 | 10.44 |
| Accounts Payable | 2,454.8 | 2,989.1 | 2,880.3 | 3,223.9 | 3,046.9 | 3,453.8 | 3,712.5 | 3,990.5 | 4,289.4 | 4,610.6 |
| Accounts Payable, % | 14.33 | 14.08 | 13.72 | 15.98 | 13.6 | 14.34 | 14.34 | 14.34 | 14.34 | 14.34 |
| Capital Expenditure | -458.8 | -685.3 | -966.1 | -1,731.5 | -1,010.0 | -1,136.6 | -1,221.7 | -1,313.2 | -1,411.6 | -1,517.3 |
| Capital Expenditure, % | -2.68 | -3.23 | -4.6 | -8.58 | -4.51 | -4.72 | -4.72 | -4.72 | -4.72 | -4.72 |
| Tax Rate, % | 7.24 | 7.24 | 7.24 | 7.24 | 7.24 | 7.24 | 7.24 | 7.24 | 7.24 | 7.24 |
| EBITAT | 1,658.4 | 1,386.0 | 1,667.9 | 1,007.7 | 692.4 | 1,557.2 | 1,673.9 | 1,799.2 | 1,934.0 | 2,078.8 |
| Depreciation | ||||||||||
| Changes in Account Receivables | ||||||||||
| Changes in Inventories | ||||||||||
| Changes in Accounts Payable | ||||||||||
| Capital Expenditure | ||||||||||
| UFCF | 1,333.0 | 1,042.4 | 1,246.9 | -570.4 | -396.3 | 834.4 | 720.2 | 774.1 | 832.1 | 894.4 |
| WACC, % | 5.85 | 5.85 | 5.84 | 5.85 | 5.85 | 5.85 | 5.85 | 5.85 | 5.85 | 5.85 |
| PV UFCF | ||||||||||
| SUM PV UFCF | 3,420.1 | |||||||||
| Long Term Growth Rate, % | 3.00 | |||||||||
| Free cash flow (T + 1) | 921 | |||||||||
| Terminal Value | 32,368 | |||||||||
| Present Terminal Value | 24,364 | |||||||||
| Enterprise Value | 27,784 | |||||||||
| Net Debt | -1,606 | |||||||||
| Equity Value | 29,390 | |||||||||
| Diluted Shares Outstanding, MM | 694 | |||||||||
| Equity Value Per Share | 42.38 |
Benefits You'll Receive
- Modifiable Forecast Inputs: Effortlessly adjust parameters (growth %, profit margins, WACC) to generate various scenarios.
- Comprehensive Data: Pre-filled financial data for Guangzhou Shiyuan Electronic Technology Company Limited (002841SZ) to enhance your analysis.
- Instant DCF Calculations: The template automatically computes the Net Present Value (NPV) and intrinsic value for you.
- Sleek and Adaptable Design: A professional Excel model that customizes to meet your valuation requirements.
- Tailored for Analysts and Investors: Perfect for evaluating projections, confirming strategies, and optimizing efficiency.
Key Features
- Comprehensive DCF Calculator: Offers detailed unlevered and levered DCF valuation frameworks tailored for Guangzhou Shiyuan Electronic Technology (002841SZ).
- WACC Analyzer: Comes with a pre-configured Weighted Average Cost of Capital module featuring adjustable inputs.
- Customizable Forecast Parameters: Easily adjust growth projections, capital expenditures, and discount rates.
- Integrated Financial Ratios: Evaluate profitability, leverage, and efficiency ratios specific to Guangzhou Shiyuan Electronic Technology (002841SZ).
- Interactive Dashboard and Visuals: Graphical representations that highlight essential valuation metrics for streamlined analysis.
How It Functions
- Download: Obtain the pre-prepared Excel file featuring Guangzhou Shiyuan Electronic Technology Company's financial data.
- Customize: Tailor forecasts such as revenue growth, EBITDA %, and WACC to suit your analysis.
- Update Automatically: Enjoy real-time updates on intrinsic value and NPV calculations.
- Test Scenarios: Generate various projections and compare results with ease.
- Make Decisions: Utilize the valuation findings to inform your investment strategy for (002841SZ).
Why Opt for This Calculator?
- All-in-One Solution: Features DCF, WACC, and financial ratio analyses seamlessly integrated.
- Tailorable Inputs: Modify the highlighted cells to explore different financial scenarios.
- In-Depth Analysis: Automatically determines the intrinsic value and Net Present Value of Guangzhou Shiyuan Electronic Technology Company Limited (002841SZ).
- Preloaded Information: Comes with historical and projected data for precise starting points.
- High-Quality Standards: Perfect for financial analysts, investors, and business consultants in the tech sector.
Who Should Use This Product?
- Investors: Accurately assess the fair value of Guangzhou Shiyuan Electronic Technology Company Limited (002841SZ) prior to making investment choices.
- CFOs: Utilize a professional-grade DCF model for financial reporting and analysis related to (002841SZ).
- Consultants: Efficiently customize the template for valuation reports tailored for clients considering (002841SZ).
- Entrepreneurs: Acquire insights into the financial modeling techniques utilized by top enterprises, including those relevant to (002841SZ).
- Educators: Implement this as a teaching resource to illustrate various valuation methodologies focusing on (002841SZ).
Contents of the Template
- Detailed DCF Model: An editable template featuring extensive valuation calculations.
- Actual Financial Data: Preloaded historical and projected financials for Guangzhou Shiyuan Electronic Technology Company Limited (002841SZ) for in-depth analysis.
- Flexible Parameters: Modify WACC, growth rates, and tax assumptions to explore various scenarios.
- Complete Financial Statements: Comprehensive annual and quarterly breakdowns for enhanced understanding.
- Essential Ratios: Integrated analysis for evaluating profitability, efficiency, and leverage.
- Interactive Dashboard: Visual outputs including charts and tables for clear, actionable insights.
Disclaimer
All information, articles, and product details provided on this website are for general informational and educational purposes only. We do not claim any ownership over, nor do we intend to infringe upon, any trademarks, copyrights, logos, brand names, or other intellectual property mentioned or depicted on this site. Such intellectual property remains the property of its respective owners, and any references here are made solely for identification or informational purposes, without implying any affiliation, endorsement, or partnership.
We make no representations or warranties, express or implied, regarding the accuracy, completeness, or suitability of any content or products presented. Nothing on this website should be construed as legal, tax, investment, financial, medical, or other professional advice. In addition, no part of this site—including articles or product references—constitutes a solicitation, recommendation, endorsement, advertisement, or offer to buy or sell any securities, franchises, or other financial instruments, particularly in jurisdictions where such activity would be unlawful.
All content is of a general nature and may not address the specific circumstances of any individual or entity. It is not a substitute for professional advice or services. Any actions you take based on the information provided here are strictly at your own risk. You accept full responsibility for any decisions or outcomes arising from your use of this website and agree to release us from any liability in connection with your use of, or reliance upon, the content or products found herein.