
|
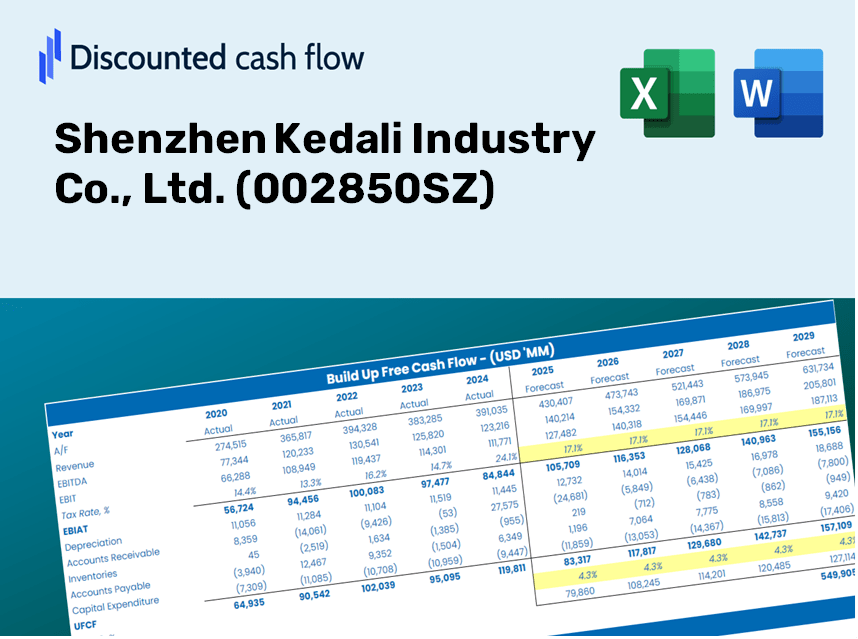
Shenzhen Kedali Industry Co., Ltd. (002850.sz) DCF Avaliação |
Totalmente Editável: Adapte-Se Às Suas Necessidades No Excel Ou Planilhas
Design Profissional: Modelos Confiáveis E Padrão Da Indústria
Pré-Construídos Para Uso Rápido E Eficiente
Compatível com MAC/PC, totalmente desbloqueado
Não É Necessária Experiência; Fácil De Seguir
Shenzhen Kedali Industry Co., Ltd. (002850.SZ) Bundle
Otimize seu tempo e melhore a precisão com a calculadora DCF (002850SZ)! Utilizando dados reais da Shenzhen Kedali Industry Co., Ltd. e suposições personalizáveis, essa ferramenta permite prever, analisar e avaliar (002850SZ) como um investidor experiente.
Discounted Cash Flow (DCF) - (USD MM)
| Year | AY1 2020 |
AY2 2021 |
AY3 2022 |
AY4 2023 |
AY5 2024 |
FY1 2025 |
FY2 2026 |
FY3 2027 |
FY4 2028 |
FY5 2029 |
|---|---|---|---|---|---|---|---|---|---|---|
| Revenue | 1,985.1 | 4,467.6 | 8,653.5 | 10,511.4 | 12,029.7 | 18,935.0 | 29,804.1 | 46,912.4 | 73,841.2 | 116,227.8 |
| Revenue Growth, % | 0 | 125.06 | 93.7 | 21.47 | 14.44 | 57.4 | 57.4 | 57.4 | 57.4 | 57.4 |
| EBITDA | 407.4 | 874.2 | 1,466.8 | 2,063.2 | 2,572.7 | 3,713.5 | 5,845.1 | 9,200.4 | 14,481.7 | 22,794.5 |
| EBITDA, % | 20.53 | 19.57 | 16.95 | 19.63 | 21.39 | 19.61 | 19.61 | 19.61 | 19.61 | 19.61 |
| Depreciation | 191.6 | 247.9 | 378.9 | 618.9 | 749.4 | 1,200.4 | 1,889.5 | 2,974.0 | 4,681.2 | 7,368.4 |
| Depreciation, % | 9.65 | 5.55 | 4.38 | 5.89 | 6.23 | 6.34 | 6.34 | 6.34 | 6.34 | 6.34 |
| EBIT | 215.8 | 626.4 | 1,087.9 | 1,444.3 | 1,823.4 | 2,513.1 | 3,955.7 | 6,226.4 | 9,800.4 | 15,426.1 |
| EBIT, % | 10.87 | 14.02 | 12.57 | 13.74 | 15.16 | 13.27 | 13.27 | 13.27 | 13.27 | 13.27 |
| Total Cash | 1,323.3 | 816.7 | 2,241.5 | 2,499.0 | 2,742.4 | 5,961.3 | 9,383.2 | 14,769.4 | 23,247.4 | 36,592.0 |
| Total Cash, percent | .0 | .0 | .0 | .0 | .0 | .0 | .0 | .0 | .0 | .0 |
| Account Receivables | 1,246.5 | 1,942.7 | 3,995.2 | 5,742.9 | 7,417.5 | 10,177.3 | 16,019.3 | 25,214.7 | 39,688.6 | 62,470.8 |
| Account Receivables, % | 62.79 | 43.49 | 46.17 | 54.64 | 61.66 | 53.75 | 53.75 | 53.75 | 53.75 | 53.75 |
| Inventories | 338.5 | 659.8 | 1,240.4 | 920.6 | 832.3 | 2,341.6 | 3,685.8 | 5,801.5 | 9,131.7 | 14,373.6 |
| Inventories, % | 17.05 | 14.77 | 14.33 | 8.76 | 6.92 | 12.37 | 12.37 | 12.37 | 12.37 | 12.37 |
| Accounts Payable | 818.1 | 1,851.3 | 3,991.0 | 1,905.1 | 4,985.6 | 7,132.4 | 11,226.6 | 17,670.9 | 27,814.4 | 43,780.6 |
| Accounts Payable, % | 41.21 | 41.44 | 46.12 | 18.12 | 41.44 | 37.67 | 37.67 | 37.67 | 37.67 | 37.67 |
| Capital Expenditure | -452.2 | -1,190.0 | -2,382.0 | -2,411.3 | -1,242.9 | -4,173.9 | -6,569.8 | -10,341.1 | -16,277.1 | -25,620.6 |
| Capital Expenditure, % | -22.78 | -26.64 | -27.53 | -22.94 | -10.33 | -22.04 | -22.04 | -22.04 | -22.04 | -22.04 |
| Tax Rate, % | 13.02 | 13.02 | 13.02 | 13.02 | 13.02 | 13.02 | 13.02 | 13.02 | 13.02 | 13.02 |
| EBITAT | 197.8 | 564.4 | 951.2 | 1,276.8 | 1,585.9 | 2,234.5 | 3,517.1 | 5,536.0 | 8,713.9 | 13,715.8 |
| Depreciation | ||||||||||
| Changes in Account Receivables | ||||||||||
| Changes in Inventories | ||||||||||
| Changes in Accounts Payable | ||||||||||
| Capital Expenditure | ||||||||||
| UFCF | -829.7 | -362.2 | -1,545.1 | -4,029.6 | 2,586.6 | -2,861.4 | -4,255.2 | -6,697.9 | -10,542.6 | -16,594.3 |
| WACC, % | 7.68 | 7.67 | 7.66 | 7.67 | 7.66 | 7.67 | 7.67 | 7.67 | 7.67 | 7.67 |
| PV UFCF | ||||||||||
| SUM PV UFCF | -31,008.5 | |||||||||
| Long Term Growth Rate, % | 4.00 | |||||||||
| Free cash flow (T + 1) | -17,258 | |||||||||
| Terminal Value | -470,474 | |||||||||
| Present Terminal Value | -325,161 | |||||||||
| Enterprise Value | -356,169 | |||||||||
| Net Debt | -610 | |||||||||
| Equity Value | -355,560 | |||||||||
| Diluted Shares Outstanding, MM | 271 | |||||||||
| Equity Value Per Share | -1,314.36 |
What You Will Receive
- Authentic 002850SZ Financial Data: Pre-loaded with Shenzhen Kedali's historical and forecasted figures for accurate analysis.
- Customizable Template: Easily adjust key inputs such as revenue growth, WACC, and EBITDA percentage.
- Instant Calculations: Watch as the intrinsic value of Shenzhen Kedali updates automatically with your modifications.
- Professional Valuation Tool: Tailored for investors, analysts, and consultants in need of precise DCF outcomes.
- User-Friendly Interface: Designed with a straightforward layout and clear guidance suitable for all skill levels.
Key Features
- Genuine Shenzhen Kedali Financial Data: Gain access to precise, pre-loaded historical figures and future estimates.
- Adjustable Forecast Parameters: Modify the yellow-highlighted cells such as WACC, growth rates, and profit margins.
- Real-Time Calculations: Instant updates to DCF, Net Present Value (NPV), and cash flow analyses.
- Interactive Dashboard: User-friendly charts and summaries to easily interpret your valuation outcomes.
- Suitable for All Experience Levels: An intuitive layout designed for investors, CFOs, and consultants alike.
How It Operates
- Download: Obtain the pre-configured Excel spreadsheet containing Shenzhen Kedali Industry Co., Ltd.'s financial data.
- Customize: Tailor your forecasts, including revenue growth, EBITDA %, and WACC to your needs.
- Update Automatically: Experience real-time updates to intrinsic value and NPV calculations.
- Test Scenarios: Generate various projections and instantly analyze the results.
- Make Decisions: Leverage the valuation outcomes to inform your investment strategies for (002850SZ).
Why Choose Shenzhen Kedali Industry Co., Ltd. (002850SZ)?
- Precision: Leverages real-time financial data for unparalleled accuracy.
- Adaptability: Built to allow users to experiment and customize inputs effortlessly.
- Efficiency: Avoid the complexity of developing financial models from the ground up.
- Expert Quality: Crafted with the expertise and standards expected by industry leaders.
- Intuitive Interface: Designed for ease of use, suitable for those with any level of financial expertise.
Who Can Benefit from This Product?
- Professional Investors: Develop precise and dependable valuation models for thorough portfolio assessments of Shenzhen Kedali Industry Co., Ltd. (002850SZ).
- Corporate Finance Teams: Evaluate valuation scenarios to inform strategic decisions within the organization.
- Consultants and Advisors: Equip clients with accurate valuation perspectives on Shenzhen Kedali Industry Co., Ltd. (002850SZ).
- Students and Educators: Utilize real-world data to enhance learning and practice in financial modeling.
- Industry Enthusiasts: Gain insights into how companies like Shenzhen Kedali Industry Co., Ltd. (002850SZ) are valued within their sector.
Contents of the Template
- Preloaded 002850SZ Data: Detailed historical and projected financial figures, encompassing revenue, EBIT, and capital expenditures.
- DCF and WACC Models: Expert-level spreadsheets designed for computing intrinsic value and Weighted Average Cost of Capital.
- Editable Inputs: Cells highlighted in yellow for easy adjustments to revenue growth, tax rates, and discount rates.
- Financial Statements: In-depth annual and quarterly financial reports for thorough analysis.
- Key Ratios: Analysis of profitability, leverage, and efficiency ratios to assess performance.
- Dashboard and Charts: Visual representations of valuation results and underlying assumptions.
Disclaimer
All information, articles, and product details provided on this website are for general informational and educational purposes only. We do not claim any ownership over, nor do we intend to infringe upon, any trademarks, copyrights, logos, brand names, or other intellectual property mentioned or depicted on this site. Such intellectual property remains the property of its respective owners, and any references here are made solely for identification or informational purposes, without implying any affiliation, endorsement, or partnership.
We make no representations or warranties, express or implied, regarding the accuracy, completeness, or suitability of any content or products presented. Nothing on this website should be construed as legal, tax, investment, financial, medical, or other professional advice. In addition, no part of this site—including articles or product references—constitutes a solicitation, recommendation, endorsement, advertisement, or offer to buy or sell any securities, franchises, or other financial instruments, particularly in jurisdictions where such activity would be unlawful.
All content is of a general nature and may not address the specific circumstances of any individual or entity. It is not a substitute for professional advice or services. Any actions you take based on the information provided here are strictly at your own risk. You accept full responsibility for any decisions or outcomes arising from your use of this website and agree to release us from any liability in connection with your use of, or reliance upon, the content or products found herein.