
|
Shenzhen Easttop Supply Chain Management Co., Ltd. (002889.SZ) Avaliação DCF |
Totalmente Editável: Adapte-Se Às Suas Necessidades No Excel Ou Planilhas
Design Profissional: Modelos Confiáveis E Padrão Da Indústria
Pré-Construídos Para Uso Rápido E Eficiente
Compatível com MAC/PC, totalmente desbloqueado
Não É Necessária Experiência; Fácil De Seguir
Shenzhen Easttop Supply Chain Management Co., Ltd. (002889.SZ) Bundle
Explore o futuro financeiro da Shenzhen Easttop Supply Chain Management Co., Ltd. (002889SZ) com nossa calculadora DCF amigável! Digite suas projeções de crescimento, margens e despesas para calcular o valor intrínseco da Shenzhen Easttop Supply Chain Management Co., Ltd. (002889SZ) e molde sua abordagem de investimento.
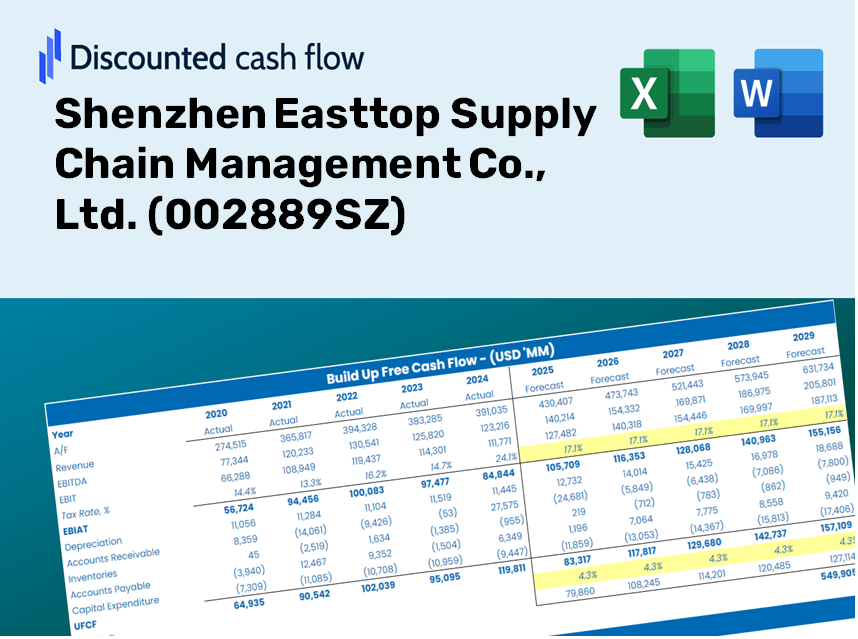
Discounted Cash Flow (DCF) - (USD MM)
| Year | AY1 2020 |
AY2 2021 |
AY3 2022 |
AY4 2023 |
AY5 2024 |
FY1 2025 |
FY2 2026 |
FY3 2027 |
FY4 2028 |
FY5 2029 |
|---|---|---|---|---|---|---|---|---|---|---|
| Revenue | 2,698.5 | 2,761.3 | 2,830.4 | 2,700.0 | 3,558.4 | 3,843.2 | 4,150.8 | 4,483.1 | 4,841.9 | 5,229.4 |
| Revenue Growth, % | 0 | 2.33 | 2.5 | -4.61 | 31.79 | 8 | 8 | 8 | 8 | 8 |
| EBITDA | 473.3 | 393.0 | 287.4 | 327.2 | 361.9 | 493.6 | 533.1 | 575.7 | 621.8 | 671.6 |
| EBITDA, % | 17.54 | 14.23 | 10.15 | 12.12 | 10.17 | 12.84 | 12.84 | 12.84 | 12.84 | 12.84 |
| Depreciation | 16.9 | 42.3 | 51.8 | 55.1 | 63.4 | 60.0 | 64.9 | 70.0 | 75.7 | 81.7 |
| Depreciation, % | 0.6248 | 1.53 | 1.83 | 2.04 | 1.78 | 1.56 | 1.56 | 1.56 | 1.56 | 1.56 |
| EBIT | 456.4 | 350.7 | 235.6 | 272.0 | 298.4 | 433.5 | 468.2 | 505.7 | 546.2 | 589.9 |
| EBIT, % | 16.91 | 12.7 | 8.32 | 10.08 | 8.39 | 11.28 | 11.28 | 11.28 | 11.28 | 11.28 |
| Total Cash | 6,035.6 | 1,918.6 | 1,976.6 | 2,168.7 | 1,548.9 | 2,791.5 | 3,014.9 | 3,256.2 | 3,516.8 | 3,798.3 |
| Total Cash, percent | .0 | .0 | .0 | .0 | .0 | .0 | .0 | .0 | .0 | .0 |
| Account Receivables | 516.6 | 1,287.7 | 326.4 | 1,006.6 | 1,745.4 | 1,257.8 | 1,358.5 | 1,467.2 | 1,584.6 | 1,711.5 |
| Account Receivables, % | 19.14 | 46.63 | 11.53 | 37.28 | 49.05 | 32.73 | 32.73 | 32.73 | 32.73 | 32.73 |
| Inventories | 2.5 | 12.4 | 32.9 | 47.7 | 37.8 | 34.8 | 37.6 | 40.6 | 43.9 | 47.4 |
| Inventories, % | 0.09383769 | 0.4486 | 1.16 | 1.77 | 1.06 | 0.90665 | 0.90665 | 0.90665 | 0.90665 | 0.90665 |
| Accounts Payable | 70.0 | 61.4 | 134.7 | 165.8 | 266.2 | 178.3 | 192.6 | 208.0 | 224.7 | 242.7 |
| Accounts Payable, % | 2.6 | 2.22 | 4.76 | 6.14 | 7.48 | 4.64 | 4.64 | 4.64 | 4.64 | 4.64 |
| Capital Expenditure | -7.5 | -109.3 | -110.9 | -164.4 | -240.6 | -161.4 | -174.4 | -188.3 | -203.4 | -219.7 |
| Capital Expenditure, % | -0.27865 | -3.96 | -3.92 | -6.09 | -6.76 | -4.2 | -4.2 | -4.2 | -4.2 | -4.2 |
| Tax Rate, % | 23.18 | 23.18 | 23.18 | 23.18 | 23.18 | 23.18 | 23.18 | 23.18 | 23.18 | 23.18 |
| EBITAT | 368.3 | 274.0 | 181.9 | 203.2 | 229.2 | 336.0 | 362.9 | 392.0 | 423.3 | 457.2 |
| Depreciation | ||||||||||
| Changes in Account Receivables | ||||||||||
| Changes in Inventories | ||||||||||
| Changes in Accounts Payable | ||||||||||
| Capital Expenditure | ||||||||||
| UFCF | -71.4 | -582.5 | 1,136.9 | -569.9 | -576.4 | 637.3 | 164.2 | 177.4 | 191.6 | 206.9 |
| WACC, % | 4.14 | 4.11 | 4.1 | 4.07 | 4.1 | 4.1 | 4.1 | 4.1 | 4.1 | 4.1 |
| PV UFCF | ||||||||||
| SUM PV UFCF | 1,253.2 | |||||||||
| Long Term Growth Rate, % | 2.00 | |||||||||
| Free cash flow (T + 1) | 211 | |||||||||
| Terminal Value | 10,027 | |||||||||
| Present Terminal Value | 8,200 | |||||||||
| Enterprise Value | 9,454 | |||||||||
| Net Debt | 349 | |||||||||
| Equity Value | 9,105 | |||||||||
| Diluted Shares Outstanding, MM | 270 | |||||||||
| Equity Value Per Share | 33.76 |
Benefits You Will Receive
- Comprehensive Financial Model: Utilize Shenzhen Easttop's real data for accurate DCF evaluations.
- Complete Forecast Control: Modify revenue growth, profit margins, WACC, and other critical factors.
- Real-Time Calculations: Automatic updates provide instant feedback as you make adjustments.
- Professional-Grade Template: A polished Excel file created for high-quality valuation presentations.
- Flexible and Reusable: Designed for adaptability, enabling repeated applications for in-depth forecasts.
Essential Features
- Customizable Forecast Inputs: Adjust vital parameters such as revenue growth, EBITDA %, and capital investments.
- Instant DCF Valuation: Automatically determines intrinsic value, NPV, and additional metrics in real-time.
- High-Precision Accuracy: Leverages Shenzhen Easttop's actual financial data for credible valuation results.
- Effortless Scenario Analysis: Easily experiment with various assumptions and evaluate different results.
- Efficiency Booster: Remove the hassle of creating intricate valuation models from the ground up.
How It Works
- Step 1: Download the prebuilt Excel template with Shenzhen Easttop Supply Chain Management Co., Ltd.'s (002889SZ) data included.
- Step 2: Browse through the pre-filled sheets to familiarize yourself with the essential metrics.
- Step 3: Adjust forecasts and assumptions in the editable yellow cells (such as WACC, growth rates, and margins).
- Step 4: Instantly see recalculated results, including the intrinsic value of Shenzhen Easttop Supply Chain Management Co., Ltd. (002889SZ).
- Step 5: Make well-informed investment decisions or create reports based on the outputs.
Why Choose Shenzhen Easttop Supply Chain Management Co., Ltd. (002889SZ)?
- Reliable Insights: Utilize accurate data from Easttop's operations for trustworthy evaluation outcomes.
- Tailored Solutions: Customize essential factors such as growth projections, operational costs, and logistics metrics to align with your business strategy.
- Efficiency Boost: Pre-configured calculations save you time and streamline your analysis process.
- Expert-Grade Resource: Crafted for use by investors, analysts, and supply chain professionals.
- Easy to Use: User-friendly design and clear, guided instructions ensure accessibility for everyone.
Who Can Benefit from This Product?
- Professional Investors: Develop comprehensive and accurate valuation models for portfolio assessment.
- Corporate Finance Teams: Evaluate valuation scenarios to inform strategic decisions within the organization.
- Consultants and Advisors: Deliver precise valuation insights for Shenzhen Easttop Supply Chain Management Co., Ltd. (002889SZ).
- Students and Educators: Utilize real-world data to enhance learning and practice financial modeling techniques.
- Supply Chain Enthusiasts: Gain insights into how companies like Shenzhen Easttop are valued in the marketplace.
What the Template Contains
- Operating and Balance Sheet Data: Pre-filled historical data and forecasts for Shenzhen Easttop Supply Chain Management Co., Ltd. (002889SZ), including metrics like revenue, EBITDA, EBIT, and capital expenditures.
- WACC Calculation: A dedicated sheet for Weighted Average Cost of Capital (WACC), featuring essential parameters such as Beta, risk-free rate, and share price.
- DCF Valuation (Unlevered and Levered): Editable Discounted Cash Flow models illustrating intrinsic value with comprehensive calculations.
- Financial Statements: Pre-loaded financial statements (annual and quarterly) to aid in detailed analysis.
- Key Ratios: Presents profitability, leverage, and efficiency ratios for Shenzhen Easttop Supply Chain Management Co., Ltd. (002889SZ).
- Dashboard and Charts: Visual representation of valuation results and underlying assumptions for easy analysis.
Disclaimer
All information, articles, and product details provided on this website are for general informational and educational purposes only. We do not claim any ownership over, nor do we intend to infringe upon, any trademarks, copyrights, logos, brand names, or other intellectual property mentioned or depicted on this site. Such intellectual property remains the property of its respective owners, and any references here are made solely for identification or informational purposes, without implying any affiliation, endorsement, or partnership.
We make no representations or warranties, express or implied, regarding the accuracy, completeness, or suitability of any content or products presented. Nothing on this website should be construed as legal, tax, investment, financial, medical, or other professional advice. In addition, no part of this site—including articles or product references—constitutes a solicitation, recommendation, endorsement, advertisement, or offer to buy or sell any securities, franchises, or other financial instruments, particularly in jurisdictions where such activity would be unlawful.
All content is of a general nature and may not address the specific circumstances of any individual or entity. It is not a substitute for professional advice or services. Any actions you take based on the information provided here are strictly at your own risk. You accept full responsibility for any decisions or outcomes arising from your use of this website and agree to release us from any liability in connection with your use of, or reliance upon, the content or products found herein.