
|
Streamx Technology Co., Ltd. (002970.sz) Avaliação DCF |
Totalmente Editável: Adapte-Se Às Suas Necessidades No Excel Ou Planilhas
Design Profissional: Modelos Confiáveis E Padrão Da Indústria
Pré-Construídos Para Uso Rápido E Eficiente
Compatível com MAC/PC, totalmente desbloqueado
Não É Necessária Experiência; Fácil De Seguir
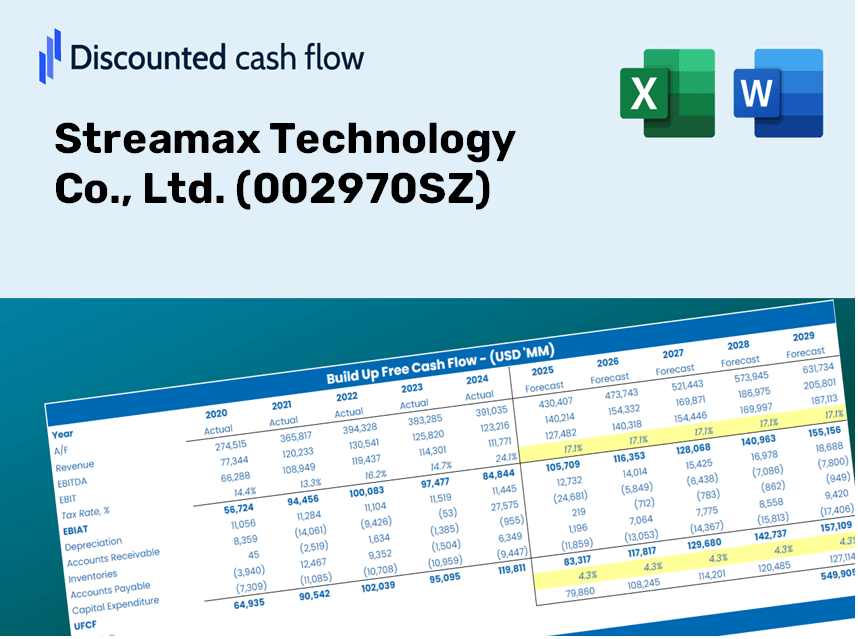
Streamax Technology Co., Ltd. (002970.SZ) Bundle
Atualize seu fluxo de trabalho e melhore a precisão com nossa calculadora [002970SZ] DCF! Equipado com dados reais da Streamx Technology Co., Ltd. e suposições personalizáveis, essa ferramenta o capacita a prever, analisar e valorizar o fluxo de fluxo como um investidor especializado.
Discounted Cash Flow (DCF) - (USD MM)
| Year | AY1 2020 |
AY2 2021 |
AY3 2022 |
AY4 2023 |
AY5 2024 |
FY1 2025 |
FY2 2026 |
FY3 2027 |
FY4 2028 |
FY5 2029 |
|---|---|---|---|---|---|---|---|---|---|---|
| Revenue | 1,609.0 | 1,712.7 | 1,383.8 | 1,699.3 | 2,777.5 | 3,287.8 | 3,891.8 | 4,606.9 | 5,453.3 | 6,455.2 |
| Revenue Growth, % | 0 | 6.45 | -19.2 | 22.8 | 63.45 | 18.37 | 18.37 | 18.37 | 18.37 | 18.37 |
| EBITDA | 219.0 | 23.2 | -88.6 | 149.9 | 301.2 | 185.6 | 219.7 | 260.1 | 307.9 | 364.5 |
| EBITDA, % | 13.61 | 1.36 | -6.4 | 8.82 | 10.85 | 5.65 | 5.65 | 5.65 | 5.65 | 5.65 |
| Depreciation | 21.0 | 35.7 | 59.1 | 66.5 | 57.8 | 89.8 | 106.2 | 125.8 | 148.9 | 176.2 |
| Depreciation, % | 1.31 | 2.08 | 4.27 | 3.91 | 2.08 | 2.73 | 2.73 | 2.73 | 2.73 | 2.73 |
| EBIT | 198.0 | -12.4 | -147.7 | 83.4 | 243.4 | 95.9 | 113.5 | 134.3 | 159.0 | 188.2 |
| EBIT, % | 12.31 | -0.72658 | -10.67 | 4.91 | 8.76 | 2.92 | 2.92 | 2.92 | 2.92 | 2.92 |
| Total Cash | 958.2 | 560.5 | 417.3 | 730.0 | 980.7 | 1,319.7 | 1,562.2 | 1,849.2 | 2,189.0 | 2,591.2 |
| Total Cash, percent | .0 | .0 | .0 | .0 | .0 | .0 | .0 | .0 | .0 | .0 |
| Account Receivables | 524.7 | 505.9 | 479.3 | 461.2 | 732.5 | 988.3 | 1,169.9 | 1,384.8 | 1,639.2 | 1,940.4 |
| Account Receivables, % | 32.61 | 29.54 | 34.64 | 27.14 | 26.37 | 30.06 | 30.06 | 30.06 | 30.06 | 30.06 |
| Inventories | 229.9 | 470.4 | 329.0 | 329.2 | 538.7 | 685.8 | 811.8 | 961.0 | 1,137.5 | 1,346.5 |
| Inventories, % | 14.29 | 27.46 | 23.78 | 19.38 | 19.4 | 20.86 | 20.86 | 20.86 | 20.86 | 20.86 |
| Accounts Payable | 437.0 | 305.2 | 267.8 | 364.3 | 414.6 | 662.2 | 783.8 | 927.8 | 1,098.3 | 1,300.1 |
| Accounts Payable, % | 27.16 | 17.82 | 19.35 | 21.44 | 14.93 | 20.14 | 20.14 | 20.14 | 20.14 | 20.14 |
| Capital Expenditure | -239.9 | -194.6 | -68.3 | -69.3 | -66.4 | -247.8 | -293.3 | -347.2 | -411.0 | -486.5 |
| Capital Expenditure, % | -14.91 | -11.36 | -4.94 | -4.08 | -2.39 | -7.54 | -7.54 | -7.54 | -7.54 | -7.54 |
| Tax Rate, % | -1 | -1 | -1 | -1 | -1 | -1 | -1 | -1 | -1 | -1 |
| EBITAT | 180.5 | -23.3 | -126.0 | 89.0 | 245.8 | 91.4 | 108.2 | 128.0 | 151.6 | 179.4 |
| Depreciation | ||||||||||
| Changes in Account Receivables | ||||||||||
| Changes in Inventories | ||||||||||
| Changes in Accounts Payable | ||||||||||
| Capital Expenditure | ||||||||||
| UFCF | -355.9 | -535.8 | -4.7 | 200.6 | -193.3 | -222.0 | -264.8 | -313.5 | -371.1 | -439.2 |
| WACC, % | 4.96 | 4.97 | 4.96 | 4.97 | 4.97 | 4.97 | 4.97 | 4.97 | 4.97 | 4.97 |
| PV UFCF | ||||||||||
| SUM PV UFCF | -1,373.1 | |||||||||
| Long Term Growth Rate, % | 2.00 | |||||||||
| Free cash flow (T + 1) | -448 | |||||||||
| Terminal Value | -15,093 | |||||||||
| Present Terminal Value | -11,843 | |||||||||
| Enterprise Value | -13,217 | |||||||||
| Net Debt | -794 | |||||||||
| Equity Value | -12,422 | |||||||||
| Diluted Shares Outstanding, MM | 175 | |||||||||
| Equity Value Per Share | -71.10 |
What You Will Receive
- Authentic 002970 Financial Data: Pre-populated with Streamax Technology's historical and future projections for accurate analysis.
- Completely Customizable Template: Easily adjust key parameters such as revenue growth, WACC, and EBITDA percentage.
- Instant Calculations: Watch the intrinsic value of Streamax Technology update in real time as you make adjustments.
- Expert Valuation Tool: Tailored for investors, analysts, and consultants who need precise DCF results.
- Intuitive Design: Straightforward layout and clear guidance suitable for all skill levels.
Key Features
- Comprehensive DCF Calculator: Offers detailed unlevered and levered DCF valuation models tailored for Streamax Technology Co., Ltd. (002970SZ).
- WACC Calculator: Features a pre-configured Weighted Average Cost of Capital sheet with customizable parameters.
- Customizable Forecast Assumptions: Adjust growth rates, capital expenditures, and discount rates as needed.
- Integrated Financial Ratios: Evaluate profitability, leverage, and efficiency ratios specific to Streamax Technology Co., Ltd. (002970SZ).
- Interactive Dashboard and Charts: Visual representations that highlight essential valuation metrics for streamlined analysis.
How It Works
- Step 1: Download the Excel file for Streamax Technology Co., Ltd. (002970SZ).
- Step 2: Review the pre-filled financial data and forecasts for Streamax.
- Step 3: Adjust key inputs such as revenue growth, WACC, and tax rates (highlighted cells).
- Step 4: Observe the DCF model update in real-time as you modify your assumptions.
- Step 5: Evaluate the outputs and leverage the results for informed investment decisions.
Why Opt for Streamax Technology's Calculator?
- Time-Efficient: Skip the hassle of building a DCF model from scratch – it’s ready for immediate use.
- Enhanced Precision: Dependable financial data and formulas minimize valuation errors.
- Fully Adjustable: Customize the model to align with your assumptions and forecasts.
- User-Friendly: Intuitive charts and outputs simplify result analysis.
- Endorsed by Professionals: Crafted for experts who prioritize accuracy and functionality.
Who Can Benefit from This Product?
- Investors: Evaluate Streamax's valuation prior to making stock transactions.
- CFOs and Financial Analysts: Optimize valuation methods and assess financial projections.
- Startup Founders: Understand the valuation processes of established public companies like Streamax Technology (002970SZ).
- Consultants: Prepare comprehensive valuation reports for clients based on Streamax's data.
- Students and Educators: Leverage real data from Streamax to practice and teach valuation strategies.
Contents of the Template
- Pre-Filled Data: Contains historical financials and forecasts for Streamax Technology Co., Ltd. (002970SZ).
- Discounted Cash Flow Model: Editable DCF valuation model featuring automatic calculations.
- Weighted Average Cost of Capital (WACC): A dedicated sheet for WACC calculation based on user-defined inputs.
- Key Financial Ratios: Insights into Streamax’s profitability, efficiency, and leverage.
- Customizable Inputs: Easily modify revenue growth, margins, and tax rates.
- Clear Dashboard: Visual representations and tables summarizing essential valuation outcomes.
Disclaimer
All information, articles, and product details provided on this website are for general informational and educational purposes only. We do not claim any ownership over, nor do we intend to infringe upon, any trademarks, copyrights, logos, brand names, or other intellectual property mentioned or depicted on this site. Such intellectual property remains the property of its respective owners, and any references here are made solely for identification or informational purposes, without implying any affiliation, endorsement, or partnership.
We make no representations or warranties, express or implied, regarding the accuracy, completeness, or suitability of any content or products presented. Nothing on this website should be construed as legal, tax, investment, financial, medical, or other professional advice. In addition, no part of this site—including articles or product references—constitutes a solicitation, recommendation, endorsement, advertisement, or offer to buy or sell any securities, franchises, or other financial instruments, particularly in jurisdictions where such activity would be unlawful.
All content is of a general nature and may not address the specific circumstances of any individual or entity. It is not a substitute for professional advice or services. Any actions you take based on the information provided here are strictly at your own risk. You accept full responsibility for any decisions or outcomes arising from your use of this website and agree to release us from any liability in connection with your use of, or reliance upon, the content or products found herein.