
|
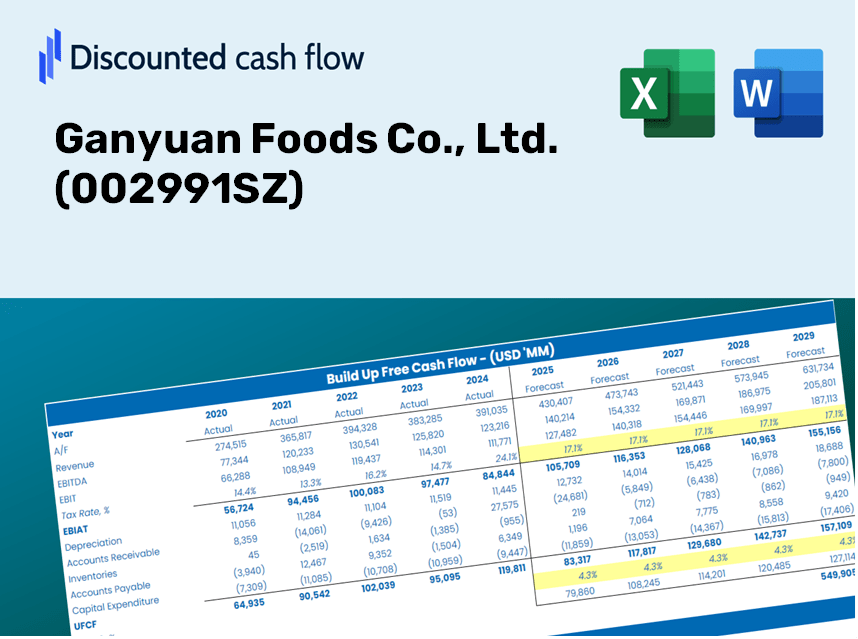
Ganyuan Foods Co., Ltd. (002991.sz) Avaliação DCF |
Totalmente Editável: Adapte-Se Às Suas Necessidades No Excel Ou Planilhas
Design Profissional: Modelos Confiáveis E Padrão Da Indústria
Pré-Construídos Para Uso Rápido E Eficiente
Compatível com MAC/PC, totalmente desbloqueado
Não É Necessária Experiência; Fácil De Seguir
Ganyuan Foods Co., Ltd. (002991.SZ) Bundle
Procurando determinar o valor intrínseco da Ganyuan Foods Co., Ltd.? Nossa calculadora DCF (002991SZ) integra dados do mundo real com extensas opções de personalização, permitindo refinar as previsões e aprimorar suas estratégias de investimento.
Benefits You'll Receive
- Comprehensive Financial Model: Ganyuan Foods' real data supports accurate DCF valuation.
- Complete Forecasting Flexibility: Modify revenue growth rates, profit margins, WACC, and other essential variables.
- Immediate Results: Automatic recalculations provide instant feedback as you adjust inputs.
- Professional-Grade Template: A polished Excel document crafted for high-quality valuation analysis.
- Adaptable and Repeatable: Designed for versatility, enabling continuous use for intricate forecasts.
Key Features
- Authentic Financial Data: Obtain precise historical data and future projections tailored for Ganyuan Foods Co., Ltd. (002991SZ).
- Customizable Forecast Variables: Modify highlighted cells such as WACC, growth rates, and profit margins to suit your analysis.
- Real-Time Calculations: Enjoy automatic updates to DCF, Net Present Value (NPV), and cash flow assessments.
- Interactive Dashboard: User-friendly charts and summaries that clearly represent your valuation findings.
- Designed for All Levels: A straightforward, intuitive design that caters to investors, CFOs, and consultants alike.
How It Functions
- 1. Access the Template: Download and open the Excel file featuring Ganyuan Foods Co., Ltd.'s preloaded data.
- 2. Modify Assumptions: Adjust key parameters such as growth rates, WACC, and capital expenditures.
- 3. View Results in Real-Time: The DCF model automatically calculates intrinsic value and NPV.
- 4. Explore Scenarios: Evaluate various forecasts to assess different valuation results.
- 5. Utilize with Assurance: Present expert valuation insights to guide your decisions.
Why Opt for Ganyuan Foods Co., Ltd. (002991SZ)?
- Time Efficient: No need to build a financial model from the ground up – we provide a ready-to-use solution.
- Enhanced Accuracy: Dependable financial data and formulas minimize errors in your evaluations.
- Completely Customizable: Adjust the model to align with your specific assumptions and forecasts.
- User-Friendly: Intuitive charts and outputs facilitate straightforward analysis of results.
- Trusted by Professionals: Crafted for experts who prioritize both precision and ease of use.
Who Can Benefit from Ganyuan Foods Co., Ltd. (002991SZ)?
- Food Industry Students: Explore market dynamics and learn about food processing techniques using real-world data.
- Researchers: Integrate industry-standard models into your studies or academic projects.
- Investors: Validate your strategies and evaluate the market performance of Ganyuan Foods Co., Ltd. (002991SZ).
- Market Analysts: Enhance your analytical process with a ready-to-use, customizable financial model.
- Entrepreneurs: Understand how major food companies like Ganyuan Foods are evaluated in the market.
Contents of the Template
- Pre-Filled Data: Contains Ganyuan Foods' historical financial performance and projections.
- Discounted Cash Flow Model: A customizable DCF valuation model with automatic computations.
- Weighted Average Cost of Capital (WACC): A specific sheet for calculating WACC using tailored inputs.
- Key Financial Ratios: Assess Ganyuan Foods' profitability, operational efficiency, and financial leverage.
- Customizable Inputs: Easily modify revenue growth rates, profit margins, and tax percentages.
- Clear Dashboard: Visual representations and tables showcasing essential valuation outcomes.
Disclaimer
All information, articles, and product details provided on this website are for general informational and educational purposes only. We do not claim any ownership over, nor do we intend to infringe upon, any trademarks, copyrights, logos, brand names, or other intellectual property mentioned or depicted on this site. Such intellectual property remains the property of its respective owners, and any references here are made solely for identification or informational purposes, without implying any affiliation, endorsement, or partnership.
We make no representations or warranties, express or implied, regarding the accuracy, completeness, or suitability of any content or products presented. Nothing on this website should be construed as legal, tax, investment, financial, medical, or other professional advice. In addition, no part of this site—including articles or product references—constitutes a solicitation, recommendation, endorsement, advertisement, or offer to buy or sell any securities, franchises, or other financial instruments, particularly in jurisdictions where such activity would be unlawful.
All content is of a general nature and may not address the specific circumstances of any individual or entity. It is not a substitute for professional advice or services. Any actions you take based on the information provided here are strictly at your own risk. You accept full responsibility for any decisions or outcomes arising from your use of this website and agree to release us from any liability in connection with your use of, or reliance upon, the content or products found herein.