
|
Chutian Dragon Co., Ltd. (003040.sz) Avaliação DCF |
Totalmente Editável: Adapte-Se Às Suas Necessidades No Excel Ou Planilhas
Design Profissional: Modelos Confiáveis E Padrão Da Indústria
Pré-Construídos Para Uso Rápido E Eficiente
Compatível com MAC/PC, totalmente desbloqueado
Não É Necessária Experiência; Fácil De Seguir
Chutian Dragon Co., Ltd. (003040.SZ) Bundle
Ganhe insights sobre sua análise de avaliação de Chutian Dragon Co., Ltd. (003040SZ) com nossa sofisticada calculadora DCF! Apresentando dados em tempo real para (003040SZ), este modelo do Excel permite ajustar as previsões e suposições, permitindo um cálculo preciso do valor intrínseco da Chutian Dragon Co., Ltd.
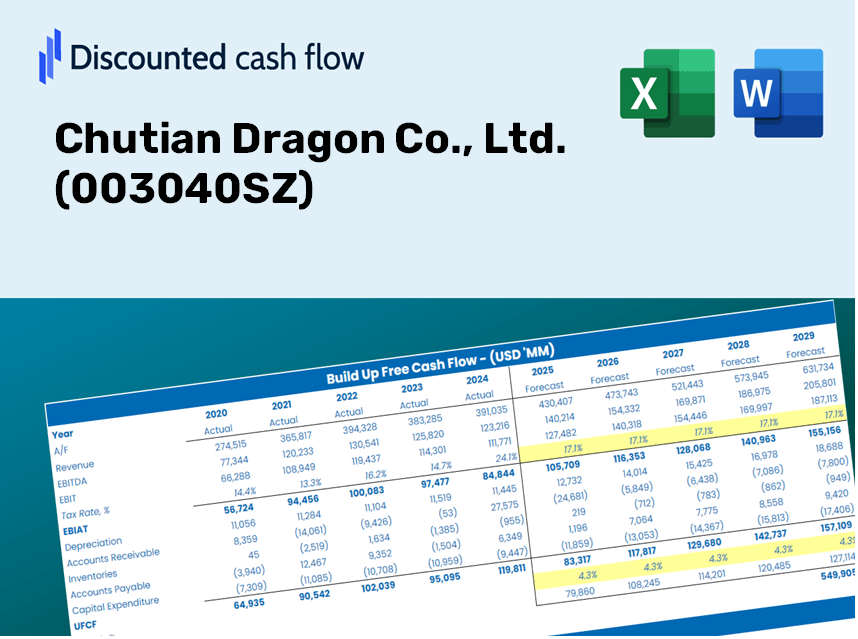
Discounted Cash Flow (DCF) - (USD MM)
| Year | AY1 2020 |
AY2 2021 |
AY3 2022 |
AY4 2023 |
AY5 2024 |
FY1 2025 |
FY2 2026 |
FY3 2027 |
FY4 2028 |
FY5 2029 |
|---|---|---|---|---|---|---|---|---|---|---|
| Revenue | 1,025.2 | 1,308.8 | 1,719.4 | 1,336.3 | 1,048.7 | 1,088.7 | 1,130.1 | 1,173.2 | 1,217.9 | 1,264.3 |
| Revenue Growth, % | 0 | 27.67 | 31.37 | -22.28 | -21.52 | 3.81 | 3.81 | 3.81 | 3.81 | 3.81 |
| EBITDA | 130.7 | 86.7 | 201.0 | 102.3 | 47.3 | 94.1 | 97.7 | 101.4 | 105.3 | 109.3 |
| EBITDA, % | 12.75 | 6.62 | 11.69 | 7.65 | 4.51 | 8.65 | 8.65 | 8.65 | 8.65 | 8.65 |
| Depreciation | 32.3 | 31.8 | 26.5 | 28.1 | 30.0 | 26.3 | 27.3 | 28.4 | 29.4 | 30.6 |
| Depreciation, % | 3.15 | 2.43 | 1.54 | 2.1 | 2.86 | 2.42 | 2.42 | 2.42 | 2.42 | 2.42 |
| EBIT | 98.4 | 54.9 | 174.5 | 74.2 | 17.4 | 67.8 | 70.4 | 73.1 | 75.9 | 78.8 |
| EBIT, % | 9.6 | 4.2 | 10.15 | 5.55 | 1.66 | 6.23 | 6.23 | 6.23 | 6.23 | 6.23 |
| Total Cash | 747.8 | 1,025.4 | 713.7 | 660.0 | 676.9 | 667.9 | 693.3 | 719.7 | 747.1 | 775.6 |
| Total Cash, percent | .0 | .0 | .0 | .0 | .0 | .0 | .0 | .0 | .0 | .0 |
| Account Receivables | 449.5 | 563.0 | 877.5 | 699.5 | 628.7 | 544.7 | 565.5 | 587.0 | 609.4 | 632.6 |
| Account Receivables, % | 43.85 | 43.01 | 51.03 | 52.34 | 59.95 | 50.04 | 50.04 | 50.04 | 50.04 | 50.04 |
| Inventories | 156.6 | 186.4 | 314.8 | 212.2 | 199.0 | 180.0 | 186.9 | 194.0 | 201.4 | 209.1 |
| Inventories, % | 15.27 | 14.24 | 18.31 | 15.88 | 18.98 | 16.54 | 16.54 | 16.54 | 16.54 | 16.54 |
| Accounts Payable | 410.4 | 523.5 | 528.6 | 374.1 | 343.0 | 373.4 | 387.6 | 402.4 | 417.7 | 433.6 |
| Accounts Payable, % | 40.04 | 40 | 30.74 | 28 | 32.7 | 34.3 | 34.3 | 34.3 | 34.3 | 34.3 |
| Capital Expenditure | -16.2 | -26.2 | -67.0 | -120.1 | -137.9 | -64.5 | -66.9 | -69.5 | -72.1 | -74.9 |
| Capital Expenditure, % | -1.58 | -2 | -3.9 | -8.98 | -13.15 | -5.92 | -5.92 | -5.92 | -5.92 | -5.92 |
| Tax Rate, % | 21.74 | 21.74 | 21.74 | 21.74 | 21.74 | 21.74 | 21.74 | 21.74 | 21.74 | 21.74 |
| EBITAT | 88.2 | 54.2 | 158.1 | 62.6 | 13.6 | 59.9 | 62.2 | 64.5 | 67.0 | 69.5 |
| Depreciation | ||||||||||
| Changes in Account Receivables | ||||||||||
| Changes in Inventories | ||||||||||
| Changes in Accounts Payable | ||||||||||
| Capital Expenditure | ||||||||||
| UFCF | -91.4 | 29.6 | -320.3 | 96.8 | -41.6 | 155.1 | 9.1 | 9.5 | 9.9 | 10.2 |
| WACC, % | 8.76 | 8.76 | 8.76 | 8.76 | 8.76 | 8.76 | 8.76 | 8.76 | 8.76 | 8.76 |
| PV UFCF | ||||||||||
| SUM PV UFCF | 171.4 | |||||||||
| Long Term Growth Rate, % | 3.00 | |||||||||
| Free cash flow (T + 1) | 11 | |||||||||
| Terminal Value | 183 | |||||||||
| Present Terminal Value | 120 | |||||||||
| Enterprise Value | 292 | |||||||||
| Net Debt | -575 | |||||||||
| Equity Value | 866 | |||||||||
| Diluted Shares Outstanding, MM | 461 | |||||||||
| Equity Value Per Share | 1.88 |
What You Will Receive
- Genuine CDR Financial Data: Pre-loaded information featuring Chutian Dragon's historical and projected figures for accurate assessments.
- Completely Customizable Template: Easily adjust crucial inputs like revenue growth, WACC, and EBITDA percentage.
- Instant Calculations: Watch as Chutian Dragon’s intrinsic value updates in real-time based on your modifications.
- Expert Valuation Tool: Tailored for investors, analysts, and consultants in pursuit of reliable DCF evaluations.
- Intuitive Design: Organized layout and straightforward guidelines suitable for users of all experience levels.
Key Features
- Genuine Chutian Dragon Data: Equipped with the company's historical performance metrics and future financial projections.
- Fully Customizable Variables: Tailor growth rates, profit margins, discount rates, tax rates, and capital expenditures to your preferences.
- Dynamic Valuation Framework: Automatic recalculations of Net Present Value (NPV) and intrinsic value based on user-defined inputs.
- Scenario Analysis: Develop various forecasting scenarios to explore different valuation possibilities.
- User-Friendly Interface: Intuitive design that caters to both seasoned professionals and newcomers.
How It Works
- 1. Access the Template: Download and open the Excel file containing Chutian Dragon Co., Ltd.'s preloaded data.
- 2. Modify Assumptions: Adjust key parameters such as growth rates, WACC, and capital expenditures.
- 3. Instant Results: The DCF model automatically calculates intrinsic value and NPV in real-time.
- 4. Explore Scenarios: Evaluate various forecasts to assess different valuation outcomes.
- 5. Present with Confidence: Share expert valuation insights to back your decision-making process.
Why Choose Chutian Dragon Co., Ltd. Calculator?
- Designed for Experts: A sophisticated tool tailored for financial analysts, CFOs, and industry consultants.
- Comprehensive Data: Preloaded with Chutian Dragon's historical and projected financial information for precise modeling.
- Versatile Scenario Analysis: Effortlessly simulate various forecasts and assumptions.
- Detailed Outputs: Instantly computes intrinsic value, NPV, and essential financial metrics.
- User-Friendly Interface: Step-by-step guidance ensures a seamless experience.
Who Should Use This Product?
- Investors: Effectively evaluate the fair value of Chutian Dragon Co., Ltd. (003040SZ) prior to making investment choices.
- CFOs: Utilize a high-quality DCF model for financial reporting and strategic analysis.
- Consultants: Easily customize the template for client valuation reports.
- Entrepreneurs: Acquire knowledge of financial modeling techniques employed by leading companies.
- Educators: Implement this resource as a teaching aid to illustrate valuation methods.
Contents of the Template
- Pre-Filled DCF Model: Chutian Dragon Co., Ltd. (003040SZ) financial data ready for immediate analysis.
- WACC Calculator: Comprehensive calculations for the Weighted Average Cost of Capital.
- Financial Ratios: Assess Chutian Dragon's profitability, leverage, and operational efficiency.
- Editable Inputs: Adjust assumptions related to growth rates, margins, and capital expenditures to fit your scenarios.
- Financial Statements: Access annual and quarterly reports for thorough analysis.
- Interactive Dashboard: Easily visualize essential valuation metrics and outcomes.
Disclaimer
All information, articles, and product details provided on this website are for general informational and educational purposes only. We do not claim any ownership over, nor do we intend to infringe upon, any trademarks, copyrights, logos, brand names, or other intellectual property mentioned or depicted on this site. Such intellectual property remains the property of its respective owners, and any references here are made solely for identification or informational purposes, without implying any affiliation, endorsement, or partnership.
We make no representations or warranties, express or implied, regarding the accuracy, completeness, or suitability of any content or products presented. Nothing on this website should be construed as legal, tax, investment, financial, medical, or other professional advice. In addition, no part of this site—including articles or product references—constitutes a solicitation, recommendation, endorsement, advertisement, or offer to buy or sell any securities, franchises, or other financial instruments, particularly in jurisdictions where such activity would be unlawful.
All content is of a general nature and may not address the specific circumstances of any individual or entity. It is not a substitute for professional advice or services. Any actions you take based on the information provided here are strictly at your own risk. You accept full responsibility for any decisions or outcomes arising from your use of this website and agree to release us from any liability in connection with your use of, or reliance upon, the content or products found herein.