
|
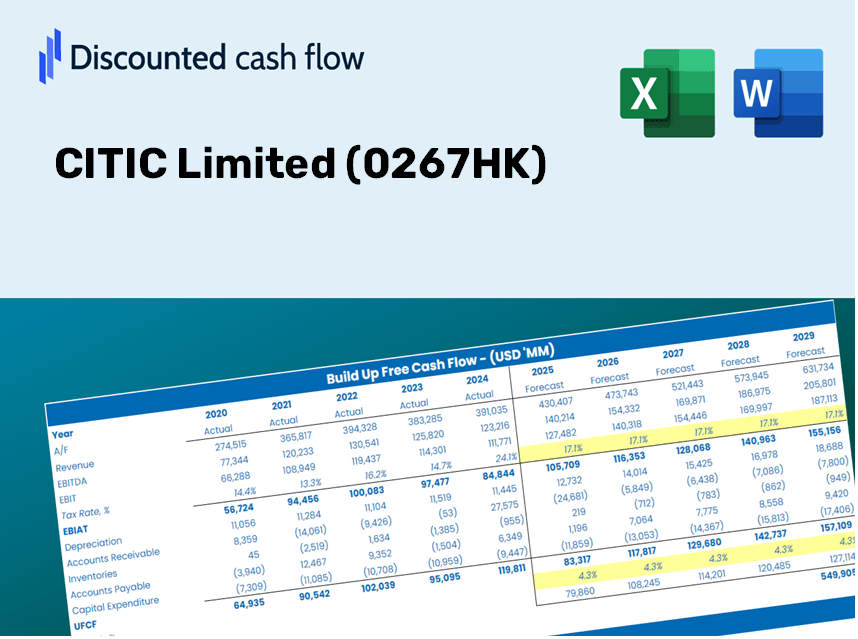
Citic Limited (0267.hk) Avaliação DCF |
Totalmente Editável: Adapte-Se Às Suas Necessidades No Excel Ou Planilhas
Design Profissional: Modelos Confiáveis E Padrão Da Indústria
Pré-Construídos Para Uso Rápido E Eficiente
Compatível com MAC/PC, totalmente desbloqueado
Não É Necessária Experiência; Fácil De Seguir
CITIC Limited (0267.HK) Bundle
Simplifique sua análise e melhore a precisão com a nossa calculadora DCF (0267HK)! Equipado com dados limitados do CITIC autênticos e suposições personalizáveis, essa ferramenta o capacita a prever, avaliar e avaliar (0267HK) como um investidor experiente.
What You Will Receive
- Adjustable Forecast Inputs: Effortlessly modify assumptions (growth %, margins, WACC) to explore various scenarios.
- Real-Time Data: CITIC Limited’s financial information pre-loaded to accelerate your analysis.
- Automated DCF Calculations: The template provides Net Present Value (NPV) and intrinsic value calculations automatically.
- Tailored and Professional: A refined Excel model that is adaptable to your valuation requirements.
- Designed for Analysts and Investors: Perfect for evaluating projections, confirming strategies, and enhancing efficiency.
Key Features
- Customizable Financial Inputs: Adjust essential parameters such as revenue growth, EBITDA percentage, and capital expenditures.
- Instant DCF Valuation: Quickly computes intrinsic value, NPV, and additional metrics.
- High-Accuracy Professional Standards: Incorporates CITIC Limited's (0267HK) real-world financial data for precise valuation results.
- User-Friendly Scenario Analysis: Easily evaluate different assumptions and observe varying outcomes.
- Efficiency-Boosting Solution: Avoid the hassle of creating intricate valuation models from the ground up.
How It Works
- 1. Access the Template: Download and open the Excel file containing CITIC Limited’s (0267HK) preloaded data.
- 2. Adjust Assumptions: Modify essential inputs such as growth rates, WACC, and capital expenditures.
- 3. Instant Results: The DCF model automatically calculates the intrinsic value and NPV in real-time.
- 4. Explore Scenarios: Analyze various forecasts to evaluate different valuation outcomes.
- 5. Present with Confidence: Showcase professional valuation insights to back your strategic decisions.
Why Select This Calculator for CITIC Limited (0267HK)?
- All-in-One Solution: Combines DCF, WACC, and financial ratio analyses within a single tool.
- Flexible Inputs: Modify the yellow-highlighted fields to explore different financial scenarios.
- In-Depth Analysis: Automatically determines CITIC Limited’s intrinsic value and Net Present Value.
- Built-in Data: Access to both historical and projected data for precise calculations.
- High-Quality Standards: Perfect for financial analysts, investors, and business consultants.
Who Can Benefit from This Product?
- Investors: Assess CITIC Limited (0267HK)’s valuation prior to making stock trades.
- CFOs and Financial Analysts: Enhance valuation workflows and validate forecasts.
- Startup Founders: Discover the valuation methods used for major publicly traded companies like CITIC Limited (0267HK).
- Consultants: Produce comprehensive valuation reports for your clients.
- Students and Educators: Utilize real market data to learn and teach valuation strategies.
Contents of the Template
- Pre-Filled DCF Model: CITIC Limited’s financial data ready for immediate application.
- WACC Calculator: Comprehensive computations for Weighted Average Cost of Capital.
- Financial Ratios: Analyze CITIC Limited’s profitability, leverage, and operational efficiency.
- Editable Inputs: Adjust parameters such as growth rates, profit margins, and CAPEX to align with your specific scenarios.
- Financial Statements: Annual and quarterly reports provided for in-depth analysis.
- Interactive Dashboard: Easily visualize essential valuation metrics and outcomes.
Disclaimer
All information, articles, and product details provided on this website are for general informational and educational purposes only. We do not claim any ownership over, nor do we intend to infringe upon, any trademarks, copyrights, logos, brand names, or other intellectual property mentioned or depicted on this site. Such intellectual property remains the property of its respective owners, and any references here are made solely for identification or informational purposes, without implying any affiliation, endorsement, or partnership.
We make no representations or warranties, express or implied, regarding the accuracy, completeness, or suitability of any content or products presented. Nothing on this website should be construed as legal, tax, investment, financial, medical, or other professional advice. In addition, no part of this site—including articles or product references—constitutes a solicitation, recommendation, endorsement, advertisement, or offer to buy or sell any securities, franchises, or other financial instruments, particularly in jurisdictions where such activity would be unlawful.
All content is of a general nature and may not address the specific circumstances of any individual or entity. It is not a substitute for professional advice or services. Any actions you take based on the information provided here are strictly at your own risk. You accept full responsibility for any decisions or outcomes arising from your use of this website and agree to release us from any liability in connection with your use of, or reliance upon, the content or products found herein.