
|
Guangdong Investment Limited (0270.hk) Avaliação DCF |
Totalmente Editável: Adapte-Se Às Suas Necessidades No Excel Ou Planilhas
Design Profissional: Modelos Confiáveis E Padrão Da Indústria
Pré-Construídos Para Uso Rápido E Eficiente
Compatível com MAC/PC, totalmente desbloqueado
Não É Necessária Experiência; Fácil De Seguir
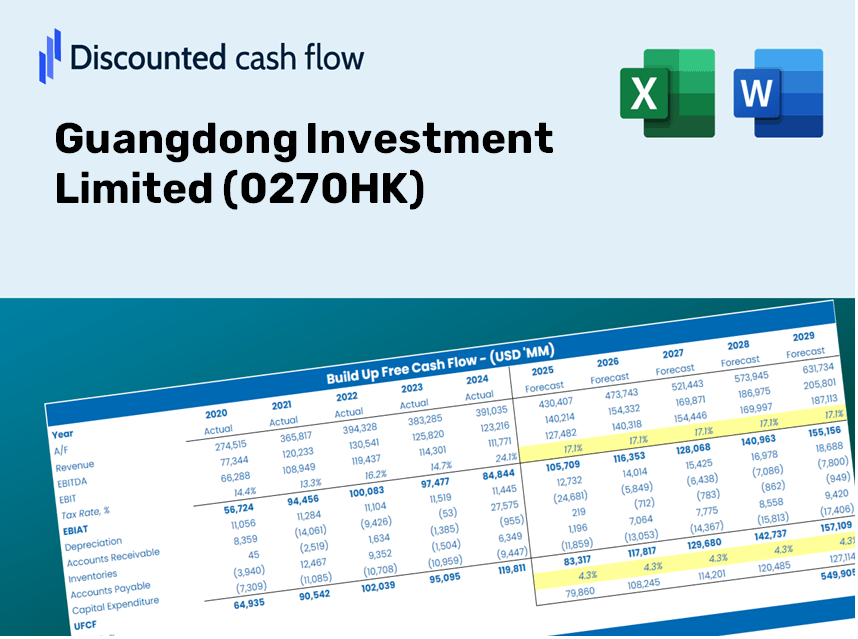
Guangdong Investment Limited (0270.HK) Bundle
Obtenha uma visão da sua análise de avaliação da Guangdong Investment Limited (0270HK) com nossa sofisticada calculadora DCF! Equipado com dados reais (0270HK), este modelo do Excel permite ajustar as previsões e suposições para determinar com precisão o valor intrínseco da Guangdong Investment Limited.
Discounted Cash Flow (DCF) - (USD MM)
| Year | AY1 2020 |
AY2 2021 |
AY3 2022 |
AY4 2023 |
AY5 2024 |
FY1 2025 |
FY2 2026 |
FY3 2027 |
FY4 2028 |
FY5 2029 |
|---|---|---|---|---|---|---|---|---|---|---|
| Revenue | 23,173.3 | 29,715.5 | 23,196.2 | 24,199.9 | 18,505.3 | 17,907.9 | 17,329.9 | 16,770.4 | 16,229.1 | 15,705.2 |
| Revenue Growth, % | 0 | 28.23 | -21.94 | 4.33 | -23.53 | -3.23 | -3.23 | -3.23 | -3.23 | -3.23 |
| EBITDA | 9,885.8 | 10,929.5 | 10,124.6 | 8,379.2 | 9,275.9 | 7,443.9 | 7,203.6 | 6,971.1 | 6,746.1 | 6,528.3 |
| EBITDA, % | 42.66 | 36.78 | 43.65 | 34.62 | 50.13 | 41.57 | 41.57 | 41.57 | 41.57 | 41.57 |
| Depreciation | 1,608.9 | 1,889.4 | 2,065.1 | 2,485.8 | 2,406.8 | 1,629.0 | 1,576.4 | 1,525.5 | 1,476.3 | 1,428.6 |
| Depreciation, % | 6.94 | 6.36 | 8.9 | 10.27 | 13.01 | 9.1 | 9.1 | 9.1 | 9.1 | 9.1 |
| EBIT | 8,276.9 | 9,040.1 | 8,059.5 | 5,893.4 | 6,869.2 | 5,815.0 | 5,627.3 | 5,445.6 | 5,269.8 | 5,099.7 |
| EBIT, % | 35.72 | 30.42 | 34.74 | 24.35 | 37.12 | 32.47 | 32.47 | 32.47 | 32.47 | 32.47 |
| Total Cash | 10,484.7 | 10,064.5 | 8,938.1 | 12,593.6 | 12,154.0 | 8,429.8 | 8,157.7 | 7,894.4 | 7,639.5 | 7,392.9 |
| Total Cash, percent | .0 | .0 | .0 | .0 | .0 | .0 | .0 | .0 | .0 | .0 |
| Account Receivables | 2,355.0 | 4,131.8 | 6,348.8 | 4,227.7 | 6,845.5 | 3,792.9 | 3,670.4 | 3,552.0 | 3,437.3 | 3,326.3 |
| Account Receivables, % | 10.16 | 13.9 | 27.37 | 17.47 | 36.99 | 21.18 | 21.18 | 21.18 | 21.18 | 21.18 |
| Inventories | 10,695.0 | 35,149.1 | 35,724.3 | 33,183.7 | 401.9 | 12,475.5 | 12,072.8 | 11,683.1 | 11,306.0 | 10,941.0 |
| Inventories, % | 46.15 | 118.29 | 154.01 | 137.12 | 2.17 | 69.66 | 69.66 | 69.66 | 69.66 | 69.66 |
| Accounts Payable | 1,330.8 | 3,827.7 | 6,224.7 | 6,070.3 | 5,611.6 | 3,612.6 | 3,496.0 | 3,383.2 | 3,274.0 | 3,168.3 |
| Accounts Payable, % | 5.74 | 12.88 | 26.83 | 25.08 | 30.32 | 20.17 | 20.17 | 20.17 | 20.17 | 20.17 |
| Capital Expenditure | -2,887.8 | -3,967.0 | -2,895.6 | -777.1 | -985.1 | -1,677.2 | -1,623.1 | -1,570.7 | -1,520.0 | -1,470.9 |
| Capital Expenditure, % | -12.46 | -13.35 | -12.48 | -3.21 | -5.32 | -9.37 | -9.37 | -9.37 | -9.37 | -9.37 |
| Tax Rate, % | 51.61 | 51.61 | 51.61 | 51.61 | 51.61 | 51.61 | 51.61 | 51.61 | 51.61 | 51.61 |
| EBITAT | 4,551.5 | 4,997.5 | 5,300.1 | 3,996.4 | 3,323.8 | 3,398.6 | 3,288.9 | 3,182.8 | 3,080.0 | 2,980.6 |
| Depreciation | ||||||||||
| Changes in Account Receivables | ||||||||||
| Changes in Inventories | ||||||||||
| Changes in Accounts Payable | ||||||||||
| Capital Expenditure | ||||||||||
| UFCF | -8,446.7 | -20,813.9 | 4,074.3 | 10,212.4 | 34,450.7 | -7,669.6 | 3,650.8 | 3,532.9 | 3,418.9 | 3,308.5 |
| WACC, % | 5.33 | 5.34 | 5.47 | 5.49 | 5.25 | 5.38 | 5.38 | 5.38 | 5.38 | 5.38 |
| PV UFCF | ||||||||||
| SUM PV UFCF | 4,347.7 | |||||||||
| Long Term Growth Rate, % | 2.00 | |||||||||
| Free cash flow (T + 1) | 3,375 | |||||||||
| Terminal Value | 99,934 | |||||||||
| Present Terminal Value | 76,911 | |||||||||
| Enterprise Value | 81,258 | |||||||||
| Net Debt | 12,510 | |||||||||
| Equity Value | 68,749 | |||||||||
| Diluted Shares Outstanding, MM | 6,538 | |||||||||
| Equity Value Per Share | 10.52 |
Benefits You Will Receive
- Accurate 0270HK Financial Data: Access historical and projected figures for precise valuation.
- Customizable Parameters: Adjust WACC, tax rates, revenue growth, and capital expenditures as needed.
- Real-Time Calculations: Intrinsic value and NPV are updated automatically.
- Comprehensive Scenario Analysis: Evaluate various scenarios to assess Guangdong Investment Limited’s future prospects.
- User-Friendly Interface: Designed for professionals while remaining easy for newcomers to navigate.
Key Features
- Comprehensive Historical Data: Access Guangdong Investment Limited’s financial statements and pre-populated forecasts.
- Customizable Variables: Modify inputs like WACC, tax rates, revenue growth, and EBITDA margins to suit your analysis.
- Real-Time Valuation: Witness the recalculation of Guangdong Investment Limited’s intrinsic value instantly.
- Intuitive Visualizations: Utilize informative dashboard charts to present valuation results and essential metrics.
- Designed for Precision: A robust tool tailored for analysts, investors, and finance professionals.
How It Functions
- 1. Access the Template: Download and open the Excel file featuring Guangdong Investment Limited’s preloaded data.
- 2. Adjust Assumptions: Modify essential inputs such as growth rates, WACC, and capital expenditures.
- 3. Get Instant Results: The DCF model automatically calculates intrinsic value and NPV.
- 4. Explore Scenarios: Evaluate multiple forecasts to understand various valuation outcomes.
- 5. Present with Confidence: Share professional valuation insights to back your decisions regarding (0270HK).
Reasons to Use This Calculator for Guangdong Investment Limited (0270HK)
- Reliable Data: Leverage authentic financials from Guangdong Investment Limited for trustworthy valuation outcomes.
- Tailorable: Modify essential parameters such as growth rates, WACC, and tax rates to fit your forecasts.
- Efficiency Boost: With pre-built calculations, you can skip the hassle of starting from the ground up.
- Industry-Standard Tool: Crafted for investors, analysts, and consultants alike.
- Easy to Navigate: A user-friendly interface and step-by-step guidance make it accessible for everyone.
Who Can Benefit from This Product?
- Investors: Accurately assess the fair value of Guangdong Investment Limited (0270HK) before making investment decisions.
- CFOs: Utilize a professional-grade DCF model for comprehensive financial reporting and analysis.
- Consultants: Easily customize the template for client valuation reports related to Guangdong Investment Limited (0270HK).
- Entrepreneurs: Discover financial modeling strategies used by leading firms in the industry.
- Educators: Employ this resource as a teaching aid to illustrate various valuation methodologies.
Contents Overview of the Template
- Pre-Filled DCF Model: Guangdong Investment Limited’s (0270HK) financial data preloaded for immediate application.
- WACC Calculator: Comprehensive calculations for Weighted Average Cost of Capital.
- Financial Ratios: Assess Guangdong Investment Limited’s (0270HK) profitability, leverage, and operational efficiency.
- Editable Inputs: Modify assumptions such as growth rates, margins, and CAPEX to suit your specific scenarios.
- Financial Statements: Includes annual and quarterly reports for in-depth analysis.
- Interactive Dashboard: Easily visualize essential valuation metrics and outcomes.
Disclaimer
All information, articles, and product details provided on this website are for general informational and educational purposes only. We do not claim any ownership over, nor do we intend to infringe upon, any trademarks, copyrights, logos, brand names, or other intellectual property mentioned or depicted on this site. Such intellectual property remains the property of its respective owners, and any references here are made solely for identification or informational purposes, without implying any affiliation, endorsement, or partnership.
We make no representations or warranties, express or implied, regarding the accuracy, completeness, or suitability of any content or products presented. Nothing on this website should be construed as legal, tax, investment, financial, medical, or other professional advice. In addition, no part of this site—including articles or product references—constitutes a solicitation, recommendation, endorsement, advertisement, or offer to buy or sell any securities, franchises, or other financial instruments, particularly in jurisdictions where such activity would be unlawful.
All content is of a general nature and may not address the specific circumstances of any individual or entity. It is not a substitute for professional advice or services. Any actions you take based on the information provided here are strictly at your own risk. You accept full responsibility for any decisions or outcomes arising from your use of this website and agree to release us from any liability in connection with your use of, or reliance upon, the content or products found herein.