
|
Petróleo da China & Avaliação DCF da Corporação Química (0386.HK) |
Totalmente Editável: Adapte-Se Às Suas Necessidades No Excel Ou Planilhas
Design Profissional: Modelos Confiáveis E Padrão Da Indústria
Pré-Construídos Para Uso Rápido E Eficiente
Compatível com MAC/PC, totalmente desbloqueado
Não É Necessária Experiência; Fácil De Seguir
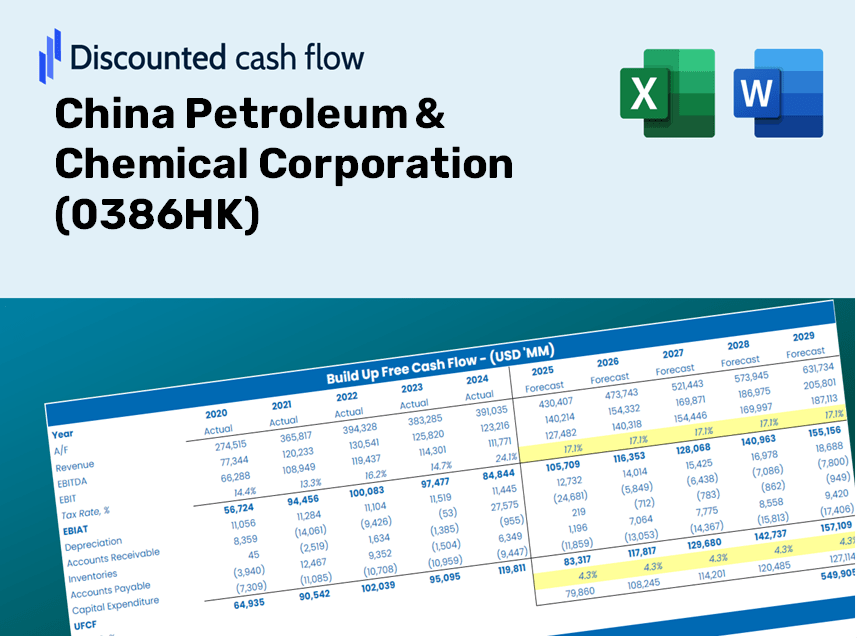
China Petroleum & Chemical Corporation (0386.HK) Bundle
Como investidor ou analista, esta calculadora DCF (0386HK) é sua ferramenta preferida para uma avaliação precisa. Equipado com dados reais da China Petroleum & Chemical Corporation, você pode ajustar as previsões e observar os efeitos em tempo real.
Discounted Cash Flow (DCF) - (USD MM)
| Year | AY1 2020 |
AY2 2021 |
AY3 2022 |
AY4 2023 |
AY5 2024 |
FY1 2025 |
FY2 2026 |
FY3 2027 |
FY4 2028 |
FY5 2029 |
|---|---|---|---|---|---|---|---|---|---|---|
| Revenue | 2,301,546.4 | 2,995,403.4 | 3,626,294.2 | 3,509,024.8 | 3,358,475.7 | 3,725,264.8 | 4,132,112.0 | 4,583,392.2 | 5,083,958.1 | 5,639,192.2 |
| Revenue Growth, % | 0 | 30.15 | 21.06 | -3.23 | -4.29 | 10.92 | 10.92 | 10.92 | 10.92 | 10.92 |
| EBITDA | 120,668.2 | 260,900.7 | 240,398.7 | 234,586.8 | 226,963.1 | 253,507.5 | 281,193.8 | 311,903.8 | 345,967.8 | 383,752.0 |
| EBITDA, % | 5.24 | 8.71 | 6.63 | 6.69 | 6.76 | 6.81 | 6.81 | 6.81 | 6.81 | 6.81 |
| Depreciation | 105,027.2 | 126,422.1 | 120,111.9 | 124,312.9 | 131,923.5 | 145,783.4 | 161,704.9 | 179,365.1 | 198,954.1 | 220,682.5 |
| Depreciation, % | 4.56 | 4.22 | 3.31 | 3.54 | 3.93 | 3.91 | 3.91 | 3.91 | 3.91 | 3.91 |
| EBIT | 15,641.0 | 134,478.7 | 120,286.8 | 110,274.0 | 95,039.5 | 107,724.1 | 119,489.0 | 132,538.7 | 147,013.6 | 163,069.4 |
| EBIT, % | 0.67959 | 4.49 | 3.32 | 3.14 | 2.83 | 2.89 | 2.89 | 2.89 | 2.89 | 2.89 |
| Total Cash | 215,067.3 | 249,093.5 | 162,356.4 | 181,153.6 | 161,958.6 | 239,329.0 | 265,466.8 | 294,459.3 | 326,618.0 | 362,289.0 |
| Total Cash, percent | .0 | .0 | .0 | .0 | .0 | .0 | .0 | .0 | .0 | .0 |
| Account Receivables | 48,437.8 | 98,265.6 | 108,226.0 | 55,597.1 | 85,493.4 | 93,128.7 | 103,299.5 | 114,581.2 | 127,094.9 | 140,975.3 |
| Account Receivables, % | 2.1 | 3.28 | 2.98 | 1.58 | 2.55 | 2.5 | 2.5 | 2.5 | 2.5 | 2.5 |
| Inventories | 166,000.0 | 226,695.3 | 266,921.3 | 274,196.5 | 280,422.5 | 285,393.3 | 316,561.9 | 351,134.6 | 389,483.0 | 432,019.6 |
| Inventories, % | 7.21 | 7.57 | 7.36 | 7.81 | 8.35 | 7.66 | 7.66 | 7.66 | 7.66 | 7.66 |
| Accounts Payable | 176,942.8 | 235,664.4 | 294,442.8 | 283,050.8 | 280,424.7 | 298,701.6 | 331,323.7 | 367,508.5 | 407,645.2 | 452,165.3 |
| Accounts Payable, % | 7.69 | 7.87 | 8.12 | 8.07 | 8.35 | 8.02 | 8.02 | 8.02 | 8.02 | 8.02 |
| Capital Expenditure | -128,819.8 | -158,378.4 | -168,020.7 | -187,417.9 | -152,132.7 | -189,159.4 | -209,818.1 | -232,732.9 | -258,150.4 | -286,343.7 |
| Capital Expenditure, % | -5.6 | -5.29 | -4.63 | -5.34 | -4.53 | -5.08 | -5.08 | -5.08 | -5.08 | -5.08 |
| Tax Rate, % | 29.22 | 29.22 | 29.22 | 29.22 | 29.22 | 29.22 | 29.22 | 29.22 | 29.22 | 29.22 |
| EBITAT | 10,759.7 | 88,661.6 | 85,287.6 | 76,608.7 | 67,269.4 | 74,518.5 | 82,656.9 | 91,684.1 | 101,697.2 | 112,803.8 |
| Depreciation | ||||||||||
| Changes in Account Receivables | ||||||||||
| Changes in Inventories | ||||||||||
| Changes in Accounts Payable | ||||||||||
| Capital Expenditure | ||||||||||
| UFCF | -50,527.9 | 4,903.7 | 45,970.9 | 47,465.4 | 8,311.7 | 36,813.4 | 25,826.3 | 28,646.8 | 31,775.4 | 35,245.7 |
| WACC, % | 4.6 | 4.54 | 4.64 | 4.61 | 4.64 | 4.6 | 4.6 | 4.6 | 4.6 | 4.6 |
| PV UFCF | ||||||||||
| SUM PV UFCF | 138,504.4 | |||||||||
| Long Term Growth Rate, % | 2.00 | |||||||||
| Free cash flow (T + 1) | 35,951 | |||||||||
| Terminal Value | 1,380,264 | |||||||||
| Present Terminal Value | 1,102,066 | |||||||||
| Enterprise Value | 1,240,571 | |||||||||
| Net Debt | 420,096 | |||||||||
| Equity Value | 820,475 | |||||||||
| Diluted Shares Outstanding, MM | 121,682 | |||||||||
| Equity Value Per Share | 6.74 |
What You Will Receive
- Authentic Sinopec Data: Pre-populated financials – encompassing everything from revenue to EBIT – derived from actual and forecasted figures.
- Comprehensive Customization: Modify all essential parameters (yellow cells) such as WACC, growth %, and tax rates.
- Immediate Valuation Adjustments: Automated recalculations to assess the effect of changes on Sinopec's fair value.
- Flexible Excel Template: Designed for quick modifications, scenario analysis, and in-depth projections.
- Efficient and Reliable: Avoid the hassle of building models from the ground up while ensuring accuracy and adaptability.
Key Features
- Accurate Financial Data for China Petroleum & Chemical Corporation (0386HK): Gain access to reliable historical data and future forecasts.
- Tailorable Forecast Parameters: Modify highlighted cells to adjust WACC, growth rates, and profit margins.
- Real-Time Calculations: Automatic recalculations for DCF, Net Present Value (NPV), and cash flow assessments.
- User-Friendly Dashboard: Intuitive charts and summaries to help you interpret your valuation findings.
- Designed for All Skill Levels: A straightforward layout suitable for investors, CFOs, and consultants alike.
How It Functions
- 1. Download the Template: Access and open the Excel file containing preloaded data for China Petroleum & Chemical Corporation (0386HK).
- 2. Modify Assumptions: Adjust essential inputs such as growth rates, WACC, and capital expenditures as needed.
- 3. Instant Results: The DCF model automatically computes intrinsic value and NPV in real-time.
- 4. Explore Different Scenarios: Evaluate multiple forecasts to investigate various valuation possibilities.
- 5. Present with Assurance: Deliver professional valuation insights to underpin your financial decisions.
Why Opt for This Calculator?
- Designed for Experts: An advanced tool tailored for analysts, CFOs, and consultants.
- Actual Data Insights: Historical and projected financials for China Petroleum & Chemical Corporation (0386HK) integrated for precision.
- Forecast Scenarios: Effortlessly model various assumptions and outcomes.
- Transparent Results: Automatically computes intrinsic value, NPV, and essential metrics.
- User-Friendly: Comprehensive step-by-step guidance simplifies the process.
Who Should Consider This Product?
- Individual Investors: Make well-informed decisions regarding the buying or selling of China Petroleum & Chemical Corporation (0386HK) shares.
- Financial Analysts: Enhance valuation workflows with pre-built financial models tailored for (0386HK).
- Consultants: Provide clients with accurate and timely valuation insights related to (0386HK).
- Business Owners: Gain a deeper understanding of how major corporations like China Petroleum & Chemical Corporation (0386HK) are valued to inform your own business strategies.
- Finance Students: Explore valuation methodologies with real-world data and scenarios involving (0386HK).
Contents of the Template
- Comprehensive DCF Model: An editable template featuring detailed valuation calculations.
- Real-World Data: Historical and projected financials of China Petroleum & Chemical Corporation (0386HK) preloaded for in-depth analysis.
- Customizable Parameters: Modify WACC, growth rates, and tax assumptions to explore various scenarios.
- Financial Statements: Complete annual and quarterly breakdowns for enhanced insights.
- Key Ratios: Integrated analysis of profitability, efficiency, and leverage metrics.
- Dashboard with Visual Outputs: Easily interpretable charts and tables that highlight actionable results.
Disclaimer
All information, articles, and product details provided on this website are for general informational and educational purposes only. We do not claim any ownership over, nor do we intend to infringe upon, any trademarks, copyrights, logos, brand names, or other intellectual property mentioned or depicted on this site. Such intellectual property remains the property of its respective owners, and any references here are made solely for identification or informational purposes, without implying any affiliation, endorsement, or partnership.
We make no representations or warranties, express or implied, regarding the accuracy, completeness, or suitability of any content or products presented. Nothing on this website should be construed as legal, tax, investment, financial, medical, or other professional advice. In addition, no part of this site—including articles or product references—constitutes a solicitation, recommendation, endorsement, advertisement, or offer to buy or sell any securities, franchises, or other financial instruments, particularly in jurisdictions where such activity would be unlawful.
All content is of a general nature and may not address the specific circumstances of any individual or entity. It is not a substitute for professional advice or services. Any actions you take based on the information provided here are strictly at your own risk. You accept full responsibility for any decisions or outcomes arising from your use of this website and agree to release us from any liability in connection with your use of, or reliance upon, the content or products found herein.