
|
Companhia Unida Rusal, International Public Joint-Stock Company (0486.HK) DCF Avaliação |
Totalmente Editável: Adapte-Se Às Suas Necessidades No Excel Ou Planilhas
Design Profissional: Modelos Confiáveis E Padrão Da Indústria
Pré-Construídos Para Uso Rápido E Eficiente
Compatível com MAC/PC, totalmente desbloqueado
Não É Necessária Experiência; Fácil De Seguir
United Company RUSAL, International Public Joint-Stock Company (0486.HK) Bundle
Simplifique sua análise e melhore a precisão com a nossa calculadora DCF (0486HK)! Utilizando dados autênticos da empresa United Company Rusal and Customizable Pressions, essa ferramenta permite que você preveja, avalie e valorize (0486HK) como um investidor especialista.
Benefits You Will Receive
- Pre-Filled Financial Model: United Company RUSAL's actual data facilitates accurate DCF valuation.
- Comprehensive Forecast Control: Modify revenue growth rates, profit margins, WACC, and other crucial factors.
- Real-Time Calculations: Automatic updates provide immediate insights as you implement changes.
- Investor-Ready Template: A polished Excel file crafted for high-quality valuation analysis.
- Customizable and Reusable: Designed for adaptability, enabling multiple uses for in-depth forecasts.
Key Features
- Comprehensive RUSAL Data: Pre-loaded with historical financials and future projections for United Company RUSAL.
- Completely Customizable Inputs: Tailor revenue growth, profit margins, WACC, tax rates, and capital expenditures to your preferences.
- Interactive Valuation Model: Automatically refreshes Net Present Value (NPV) and intrinsic value based on your adjustments.
- Scenario Analysis: Develop various forecast scenarios to evaluate different valuation results.
- User-Friendly Interface: Intuitive and structured design suitable for both experts and newcomers.
How It Functions
- Download the Template: Gain immediate access to the Excel-based RUSAL DCF Calculator.
- Input Your Assumptions: Modify the yellow-highlighted cells for growth rates, WACC, profit margins, and other variables.
- Instant Calculations: The model will automatically refresh RUSAL’s intrinsic value.
- Test Scenarios: Experiment with different assumptions to assess potential valuation outcomes.
- Analyze and Decide: Utilize the findings to inform your investment or financial decision-making.
Why Choose This Calculator?
- Designed for Industry Experts: A sophisticated tool tailored for analysts, CFOs, and consultants in the metals and mining sector.
- Accurate Financial Insights: United Company RUSAL's historical and projected financial data preloaded for enhanced reliability.
- Flexible Scenario Analysis: Easily test various forecasts and assumptions to evaluate different outcomes.
- Comprehensive Outputs: Instantly calculates intrinsic value, NPV, and other essential financial metrics.
- User-Friendly Interface: Clear step-by-step guidance helps you navigate the calculations effortlessly.
Who Should Utilize This Product?
- Individual Investors: Make informed decisions regarding the purchase or sale of United Company RUSAL stock (0486HK).
- Financial Analysts: Enhance valuation processes with convenient, ready-to-implement financial models.
- Consultants: Provide clients with accurate and timely valuation insights.
- Business Owners: Gain insights into how major corporations like United Company RUSAL are valued to inform your own business strategies.
- Finance Students: Master valuation techniques using real-world data and practical examples.
Contents of the Template
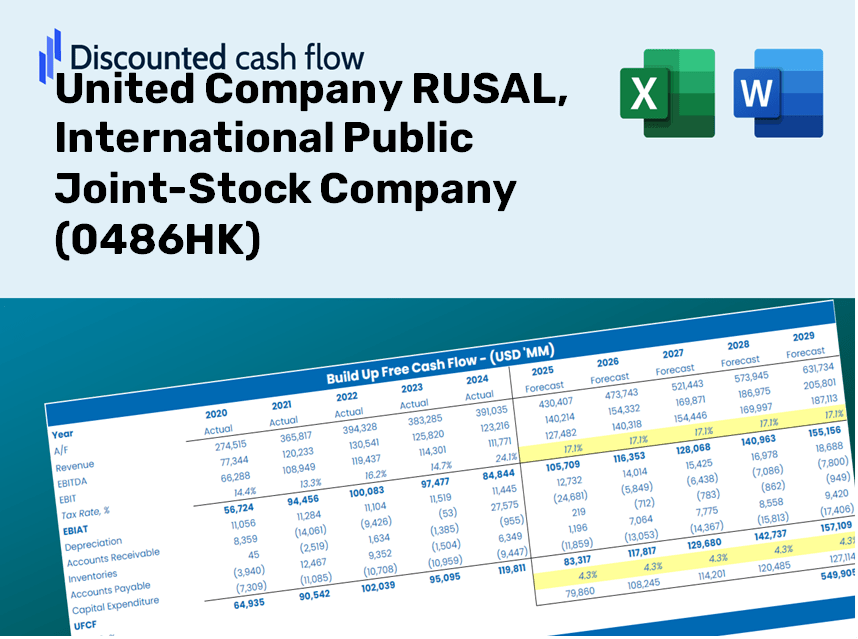
- Preloaded RUSAL Data: Historical and forecasted financial metrics, including revenue, EBIT, and capital expenditures.
- DCF and WACC Models: Advanced worksheets for determining intrinsic value and Weighted Average Cost of Capital.
- Editable Inputs: Yellow-highlighted cells to modify revenue growth, tax rates, and discount rates.
- Financial Statements: Detailed annual and quarterly financial reports for in-depth analysis.
- Key Ratios: Metrics for profitability, leverage, and efficiency to assess performance.
- Dashboard and Charts: Visual representations of valuation results and underlying assumptions.
Disclaimer
All information, articles, and product details provided on this website are for general informational and educational purposes only. We do not claim any ownership over, nor do we intend to infringe upon, any trademarks, copyrights, logos, brand names, or other intellectual property mentioned or depicted on this site. Such intellectual property remains the property of its respective owners, and any references here are made solely for identification or informational purposes, without implying any affiliation, endorsement, or partnership.
We make no representations or warranties, express or implied, regarding the accuracy, completeness, or suitability of any content or products presented. Nothing on this website should be construed as legal, tax, investment, financial, medical, or other professional advice. In addition, no part of this site—including articles or product references—constitutes a solicitation, recommendation, endorsement, advertisement, or offer to buy or sell any securities, franchises, or other financial instruments, particularly in jurisdictions where such activity would be unlawful.
All content is of a general nature and may not address the specific circumstances of any individual or entity. It is not a substitute for professional advice or services. Any actions you take based on the information provided here are strictly at your own risk. You accept full responsibility for any decisions or outcomes arising from your use of this website and agree to release us from any liability in connection with your use of, or reliance upon, the content or products found herein.