
|
Nanjing Panda Electronics Company Limited (0553.HK) Avaliação DCF |
Totalmente Editável: Adapte-Se Às Suas Necessidades No Excel Ou Planilhas
Design Profissional: Modelos Confiáveis E Padrão Da Indústria
Pré-Construídos Para Uso Rápido E Eficiente
Compatível com MAC/PC, totalmente desbloqueado
Não É Necessária Experiência; Fácil De Seguir
Nanjing Panda Electronics Company Limited (0553.HK) Bundle
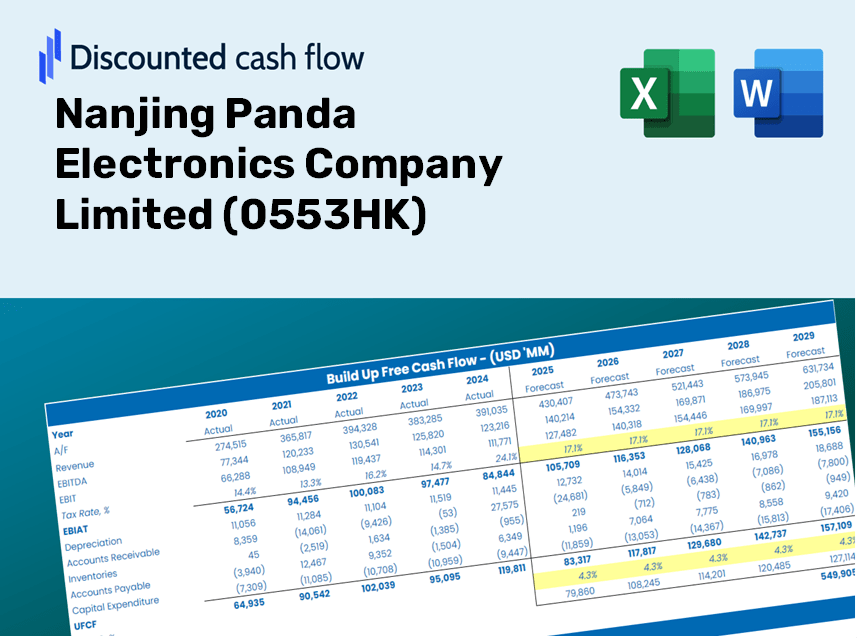
Seja você um investidor ou analista, esta calculadora DCF (0553HK) é sua ferramenta essencial para uma avaliação precisa. Com dados reais da Nanjing Panda Electronics Company Limited pré -carregados, você pode ajustar as previsões e observar os efeitos em tempo real.
Discounted Cash Flow (DCF) - (USD MM)
| Year | AY1 2020 |
AY2 2021 |
AY3 2022 |
AY4 2023 |
AY5 2024 |
FY1 2025 |
FY2 2026 |
FY3 2027 |
FY4 2028 |
FY5 2029 |
|---|---|---|---|---|---|---|---|---|---|---|
| Revenue | 4,319.3 | 4,952.7 | 4,540.1 | 3,182.7 | 2,891.6 | 2,655.1 | 2,438.0 | 2,238.6 | 2,055.5 | 1,887.4 |
| Revenue Growth, % | 0 | 14.66 | -8.33 | -29.9 | -9.15 | -8.18 | -8.18 | -8.18 | -8.18 | -8.18 |
| EBITDA | 286.8 | 235.9 | 232.2 | -70.0 | -26.2 | 71.2 | 65.4 | 60.0 | 55.1 | 50.6 |
| EBITDA, % | 6.64 | 4.76 | 5.11 | -2.2 | -0.90749 | 2.68 | 2.68 | 2.68 | 2.68 | 2.68 |
| Depreciation | 118.9 | 119.7 | 121.7 | 119.1 | 109.4 | 81.7 | 75.0 | 68.8 | 63.2 | 58.0 |
| Depreciation, % | 2.75 | 2.42 | 2.68 | 3.74 | 3.78 | 3.08 | 3.08 | 3.08 | 3.08 | 3.08 |
| EBIT | 167.9 | 116.3 | 110.5 | -189.2 | -135.6 | -10.4 | -9.6 | -8.8 | -8.1 | -7.4 |
| EBIT, % | 3.89 | 2.35 | 2.43 | -5.94 | -4.69 | -0.39344 | -0.39344 | -0.39344 | -0.39344 | -0.39344 |
| Total Cash | 1,985.8 | 1,568.8 | 1,708.4 | 1,488.8 | 1,365.2 | 1,111.3 | 1,020.4 | 937.0 | 860.3 | 790.0 |
| Total Cash, percent | .0 | .0 | .0 | .0 | .0 | .0 | .0 | .0 | .0 | .0 |
| Account Receivables | 1,550.2 | 1,473.2 | 1,645.1 | 1,135.3 | 1,876.6 | 1,075.0 | 987.1 | 906.4 | 832.2 | 764.2 |
| Account Receivables, % | 35.89 | 29.75 | 36.23 | 35.67 | 64.9 | 40.49 | 40.49 | 40.49 | 40.49 | 40.49 |
| Inventories | 864.8 | 1,066.0 | 657.3 | 623.8 | 533.1 | 499.5 | 458.6 | 421.1 | 386.7 | 355.1 |
| Inventories, % | 20.02 | 21.52 | 14.48 | 19.6 | 18.44 | 18.81 | 18.81 | 18.81 | 18.81 | 18.81 |
| Accounts Payable | 1,957.6 | 1,991.7 | 1,829.3 | 1,659.0 | 1,572.1 | 1,233.7 | 1,132.8 | 1,040.2 | 955.1 | 877.0 |
| Accounts Payable, % | 45.32 | 40.21 | 40.29 | 52.12 | 54.37 | 46.46 | 46.46 | 46.46 | 46.46 | 46.46 |
| Capital Expenditure | -77.6 | -54.8 | -22.4 | -15.1 | -41.3 | -28.1 | -25.8 | -23.7 | -21.8 | -20.0 |
| Capital Expenditure, % | -1.8 | -1.11 | -0.49234 | -0.47462 | -1.43 | -1.06 | -1.06 | -1.06 | -1.06 | -1.06 |
| Tax Rate, % | -51.54 | -51.54 | -51.54 | -51.54 | -51.54 | -51.54 | -51.54 | -51.54 | -51.54 | -51.54 |
| EBITAT | 85.4 | 46.1 | 43.8 | -259.0 | -205.6 | -6.9 | -6.3 | -5.8 | -5.3 | -4.9 |
| Depreciation | ||||||||||
| Changes in Account Receivables | ||||||||||
| Changes in Inventories | ||||||||||
| Changes in Accounts Payable | ||||||||||
| Capital Expenditure | ||||||||||
| UFCF | -330.7 | 20.9 | 217.4 | 218.0 | -875.0 | 543.4 | 70.7 | 64.9 | 59.6 | 54.7 |
| WACC, % | 7.06 | 7.06 | 7.06 | 7.08 | 7.08 | 7.07 | 7.07 | 7.07 | 7.07 | 7.07 |
| PV UFCF | ||||||||||
| SUM PV UFCF | 706.3 | |||||||||
| Long Term Growth Rate, % | 2.00 | |||||||||
| Free cash flow (T + 1) | 56 | |||||||||
| Terminal Value | 1,101 | |||||||||
| Present Terminal Value | 783 | |||||||||
| Enterprise Value | 1,489 | |||||||||
| Net Debt | -777 | |||||||||
| Equity Value | 2,266 | |||||||||
| Diluted Shares Outstanding, MM | 914 | |||||||||
| Equity Value Per Share | 2.48 |
Benefits You Will Enjoy
- Authentic 0553HK Financial Data: Access historical and projected figures for precise valuation.
- Customizable Inputs: Adjust WACC, tax rates, revenue growth, and capital expenditures as needed.
- Automated Calculations: Receive real-time calculations of intrinsic value and NPV.
- Scenario Analysis: Explore various scenarios to assess the future performance of Nanjing Panda Electronics.
- User-Friendly Design: Designed for professionals while remaining accessible to newcomers.
Essential Features
- Accurate Financial Data: Gain access to reliable pre-loaded historical figures and future forecasts for Nanjing Panda Electronics Company Limited (0553HK).
- Adjustable Forecast Parameters: Modify the yellow-highlighted fields such as WACC, growth rates, and profit margins easily.
- Automated Calculations: Real-time updates to DCF, Net Present Value (NPV), and cash flow assessments.
- Interactive Dashboard: User-friendly charts and summaries to clearly present your valuation findings.
- Designed for Everyone: An intuitive setup suitable for investors, CFOs, and consultants, regardless of expertise.
How It Operates
- Download the Template: Gain immediate access to the Excel-based Nanjing Panda DCF Calculator for [0553HK].
- Input Your Assumptions: Modify the yellow-highlighted fields for growth rates, WACC, margins, and more.
- Instant Calculations: The model automatically refreshes to reflect Nanjing Panda's intrinsic value.
- Test Scenarios: Experiment with various assumptions to assess potential changes in valuation.
- Analyze and Decide: Utilize the findings to inform your investment or financial analysis.
Why Opt for This Calculator?
- Reliable Data: Up-to-date Nanjing Panda financials provide trustworthy valuation outcomes.
- Tailorable: Modify essential variables such as growth rates, WACC, and tax rates to align with your forecasts.
- Efficiency Boost: Built-in calculations save you the effort of starting from scratch.
- Expert-Quality Tool: Crafted for investors, analysts, and consultants alike.
- Easy to Use: Simple design and detailed guidance ensure accessibility for all users.
Who Can Benefit from Nanjing Panda Electronics Company Limited (0553HK)?
- Investors: Make informed decisions with our professional-grade valuation tool tailored for your needs.
- Financial Analysts: Streamline your workflow with a customizable pre-built DCF model at your fingertips.
- Consultants: Effortlessly modify the template to create impactful presentations or reports for your clients.
- Finance Enthusiasts: Enhance your grasp of valuation techniques through practical, real-world examples.
- Educators and Students: Utilize this resource as a hands-on learning tool in finance-related coursework.
Contents of the Template
- Comprehensive DCF Model: An editable template featuring in-depth valuation calculations.
- Real-World Data: Nanjing Panda Electronics Company Limited's (0553HK) historical and forecasted financials preloaded for detailed analysis.
- Customizable Parameters: Modify WACC, growth rates, and tax assumptions to explore various scenarios.
- Financial Statements: Complete annual and quarterly breakdowns for enhanced insights.
- Key Ratios: Integrated analysis tools for evaluating profitability, efficiency, and leverage.
- Dashboard with Visual Outputs: Interactive charts and tables for clear and actionable insights.
Disclaimer
All information, articles, and product details provided on this website are for general informational and educational purposes only. We do not claim any ownership over, nor do we intend to infringe upon, any trademarks, copyrights, logos, brand names, or other intellectual property mentioned or depicted on this site. Such intellectual property remains the property of its respective owners, and any references here are made solely for identification or informational purposes, without implying any affiliation, endorsement, or partnership.
We make no representations or warranties, express or implied, regarding the accuracy, completeness, or suitability of any content or products presented. Nothing on this website should be construed as legal, tax, investment, financial, medical, or other professional advice. In addition, no part of this site—including articles or product references—constitutes a solicitation, recommendation, endorsement, advertisement, or offer to buy or sell any securities, franchises, or other financial instruments, particularly in jurisdictions where such activity would be unlawful.
All content is of a general nature and may not address the specific circumstances of any individual or entity. It is not a substitute for professional advice or services. Any actions you take based on the information provided here are strictly at your own risk. You accept full responsibility for any decisions or outcomes arising from your use of this website and agree to release us from any liability in connection with your use of, or reliance upon, the content or products found herein.