
|
Shougang Fushan Resources Group Limited (0639.HK) Avaliação DCF |
Totalmente Editável: Adapte-Se Às Suas Necessidades No Excel Ou Planilhas
Design Profissional: Modelos Confiáveis E Padrão Da Indústria
Pré-Construídos Para Uso Rápido E Eficiente
Compatível com MAC/PC, totalmente desbloqueado
Não É Necessária Experiência; Fácil De Seguir
Shougang Fushan Resources Group Limited (0639.HK) Bundle
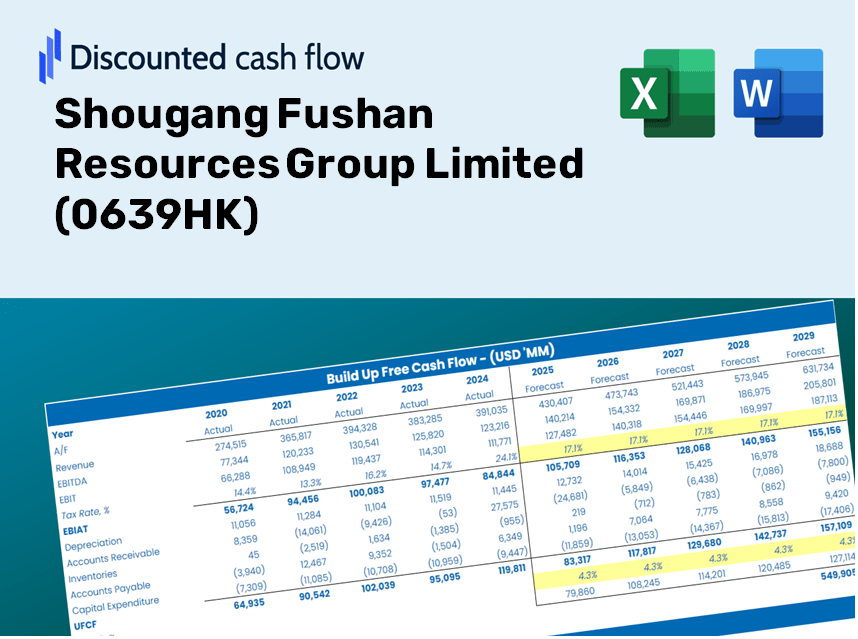
Obtenha informações sobre o seu Shougang Fushan Resources Group Limited (0639HK) Análise de avaliação com nossa sofisticada calculadora DCF! Carregado com dados reais (0639HK), este modelo do Excel permite ajustar as previsões e suposições para determinar com precisão o valor intrínseco do grupo de recursos Shougang Fushan Limited.
Discounted Cash Flow (DCF) - (USD MM)
| Year | AY1 2020 |
AY2 2021 |
AY3 2022 |
AY4 2023 |
AY5 2024 |
FY1 2025 |
FY2 2026 |
FY3 2027 |
FY4 2028 |
FY5 2029 |
|---|---|---|---|---|---|---|---|---|---|---|
| Revenue | 3,997.0 | 7,075.8 | 8,214.7 | 5,891.1 | 5,057.0 | 5,697.7 | 6,419.7 | 7,233.1 | 8,149.5 | 9,182.1 |
| Revenue Growth, % | 0 | 77.03 | 16.1 | -28.29 | -14.16 | 12.67 | 12.67 | 12.67 | 12.67 | 12.67 |
| EBITDA | 2,176.7 | 4,733.7 | 5,412.8 | 3,922.1 | 2,952.6 | 3,557.8 | 4,008.6 | 4,516.5 | 5,088.8 | 5,733.5 |
| EBITDA, % | 54.46 | 66.9 | 65.89 | 66.58 | 58.39 | 62.44 | 62.44 | 62.44 | 62.44 | 62.44 |
| Depreciation | 562.7 | 599.3 | 785.3 | 700.7 | 694.5 | 657.9 | 741.3 | 835.2 | 941.0 | 1,060.2 |
| Depreciation, % | 14.08 | 8.47 | 9.56 | 11.89 | 13.73 | 11.55 | 11.55 | 11.55 | 11.55 | 11.55 |
| EBIT | 1,614.1 | 4,134.4 | 4,627.6 | 3,221.3 | 2,258.1 | 2,899.9 | 3,267.4 | 3,681.3 | 4,147.8 | 4,673.3 |
| EBIT, % | 40.38 | 58.43 | 56.33 | 54.68 | 44.65 | 50.9 | 50.9 | 50.9 | 50.9 | 50.9 |
| Total Cash | 4,062.1 | 6,542.1 | 7,204.9 | 7,987.8 | 9,181.3 | 5,471.7 | 6,165.0 | 6,946.1 | 7,826.2 | 8,817.8 |
| Total Cash, percent | .0 | .0 | .0 | .0 | .0 | .0 | .0 | .0 | .0 | .0 |
| Account Receivables | 2,049.1 | 3,382.7 | 3,088.0 | 687.8 | 562.6 | 1,817.2 | 2,047.4 | 2,306.9 | 2,599.1 | 2,928.5 |
| Account Receivables, % | 51.27 | 47.81 | 37.59 | 11.68 | 11.12 | 31.89 | 31.89 | 31.89 | 31.89 | 31.89 |
| Inventories | 131.2 | 142.7 | 42.0 | 125.6 | 137.6 | 121.5 | 136.9 | 154.3 | 173.8 | 195.8 |
| Inventories, % | 3.28 | 2.02 | 0.51184 | 2.13 | 2.72 | 2.13 | 2.13 | 2.13 | 2.13 | 2.13 |
| Accounts Payable | 592.6 | 607.2 | 614.7 | 621.5 | 757.5 | 642.9 | 724.4 | 816.2 | 919.6 | 1,036.1 |
| Accounts Payable, % | 14.83 | 8.58 | 7.48 | 10.55 | 14.98 | 11.28 | 11.28 | 11.28 | 11.28 | 11.28 |
| Capital Expenditure | -469.1 | -495.4 | -385.6 | -489.3 | -442.3 | -461.3 | -519.8 | -585.6 | -659.8 | -743.4 |
| Capital Expenditure, % | -11.74 | -7 | -4.69 | -8.31 | -8.75 | -8.1 | -8.1 | -8.1 | -8.1 | -8.1 |
| Tax Rate, % | 40.85 | 40.85 | 40.85 | 40.85 | 40.85 | 40.85 | 40.85 | 40.85 | 40.85 | 40.85 |
| EBITAT | 1,080.9 | 2,539.3 | 2,716.2 | 1,890.7 | 1,335.7 | 1,768.5 | 1,992.6 | 2,245.0 | 2,529.5 | 2,850.0 |
| Depreciation | ||||||||||
| Changes in Account Receivables | ||||||||||
| Changes in Inventories | ||||||||||
| Changes in Accounts Payable | ||||||||||
| Capital Expenditure | ||||||||||
| UFCF | -413.2 | 1,312.7 | 3,518.7 | 4,425.4 | 1,837.2 | 612.0 | 2,049.9 | 2,309.6 | 2,602.2 | 2,932.0 |
| WACC, % | 6.39 | 6.39 | 6.39 | 6.39 | 6.39 | 6.39 | 6.39 | 6.39 | 6.39 | 6.39 |
| PV UFCF | ||||||||||
| SUM PV UFCF | 8,485.9 | |||||||||
| Long Term Growth Rate, % | 2.00 | |||||||||
| Free cash flow (T + 1) | 2,991 | |||||||||
| Terminal Value | 68,092 | |||||||||
| Present Terminal Value | 49,951 | |||||||||
| Enterprise Value | 58,437 | |||||||||
| Net Debt | -7,632 | |||||||||
| Equity Value | 66,070 | |||||||||
| Diluted Shares Outstanding, MM | 4,961 | |||||||||
| Equity Value Per Share | 13.32 |
What You Will Receive
- Pre-Filled Financial Model: Utilize Shougang Fushan Resources Group Limited's (0639HK) actual data for accurate DCF valuation.
- Comprehensive Forecast Control: Tailor revenue growth, profit margins, WACC, and other essential metrics to your needs.
- Instantaneous Calculations: Automatic updates allow you to see results in real-time as adjustments are made.
- Investor-Ready Template: A polished Excel file crafted for professional-level valuations.
- Versatile and Reusable: Designed for adaptability, making it suitable for repeated in-depth forecasting.
Key Features
- Customizable Forecast Variables: Adjust essential inputs such as revenue growth, EBITDA margin, and capital investments.
- Instant DCF Valuation: Outputs intrinsic value, NPV, and other financial metrics automatically.
- Industry-Leading Precision: Based on Shougang Fushan's actual financial data for dependable valuation results.
- Simplified Scenario Analysis: Effortlessly evaluate various assumptions and analyze different outcomes.
- Efficiency Booster: Removes the hassle of constructing intricate valuation models from the ground up.
How It Works
- Step 1: Download the Excel file for Shougang Fushan Resources Group Limited (0639HK).
- Step 2: Examine the pre-filled financial data and forecasts for Shougang Fushan.
- Step 3: Adjust key inputs such as revenue growth, WACC, and tax rates (highlighted cells).
- Step 4: Observe the DCF model update in real-time as you modify your assumptions.
- Step 5: Evaluate the results and leverage the insights for your investment choices.
Why Select This Calculator for Shougang Fushan Resources Group Limited (0639HK)?
- User-Friendly Interface: Tailored for both novices and seasoned users.
- Customizable Inputs: Adjust variables effortlessly to fit your financial analysis.
- Real-Time Valuation: Watch immediate updates to the valuation of Shougang Fushan as you change inputs.
- Pre-Loaded Data: Comes with Shougang's actual financial information for swift assessments.
- Relied Upon by Experts: Utilized by investors and analysts for making well-informed choices.
Who Should Consider Using This Product?
- Investors: Effectively assess the fair value of Shougang Fushan Resources Group Limited (0639HK) before making informed investment choices.
- CFOs: Utilize a high-quality DCF model for accurate financial reporting and analysis.
- Consultants: Seamlessly customize the template for client valuation reports.
- Entrepreneurs: Discover valuable financial modeling strategies employed by leading companies.
- Educators: Incorporate it as a resource to teach valuation techniques and methodologies.
Contents of the Template
- Historical Data: Contains past financial results and baseline forecasts for Shougang Fushan Resources Group Limited (0639HK).
- DCF and Levered DCF Models: Comprehensive templates designed to calculate the intrinsic value of Shougang Fushan Resources Group Limited (0639HK).
- WACC Sheet: Pre-configured calculations for the Weighted Average Cost of Capital.
- Editable Inputs: Customize essential drivers such as growth rates, EBITDA percentages, and CAPEX assumptions.
- Quarterly and Annual Statements: A full analysis of Shougang Fushan Resources Group Limited’s (0639HK) financials.
- Interactive Dashboard: Dynamically visualize valuation results and forecasts.
Disclaimer
All information, articles, and product details provided on this website are for general informational and educational purposes only. We do not claim any ownership over, nor do we intend to infringe upon, any trademarks, copyrights, logos, brand names, or other intellectual property mentioned or depicted on this site. Such intellectual property remains the property of its respective owners, and any references here are made solely for identification or informational purposes, without implying any affiliation, endorsement, or partnership.
We make no representations or warranties, express or implied, regarding the accuracy, completeness, or suitability of any content or products presented. Nothing on this website should be construed as legal, tax, investment, financial, medical, or other professional advice. In addition, no part of this site—including articles or product references—constitutes a solicitation, recommendation, endorsement, advertisement, or offer to buy or sell any securities, franchises, or other financial instruments, particularly in jurisdictions where such activity would be unlawful.
All content is of a general nature and may not address the specific circumstances of any individual or entity. It is not a substitute for professional advice or services. Any actions you take based on the information provided here are strictly at your own risk. You accept full responsibility for any decisions or outcomes arising from your use of this website and agree to release us from any liability in connection with your use of, or reliance upon, the content or products found herein.