
|
China Eastern Airlines Corporation Limited (0670.HK) Avaliação DCF |
Totalmente Editável: Adapte-Se Às Suas Necessidades No Excel Ou Planilhas
Design Profissional: Modelos Confiáveis E Padrão Da Indústria
Pré-Construídos Para Uso Rápido E Eficiente
Compatível com MAC/PC, totalmente desbloqueado
Não É Necessária Experiência; Fácil De Seguir
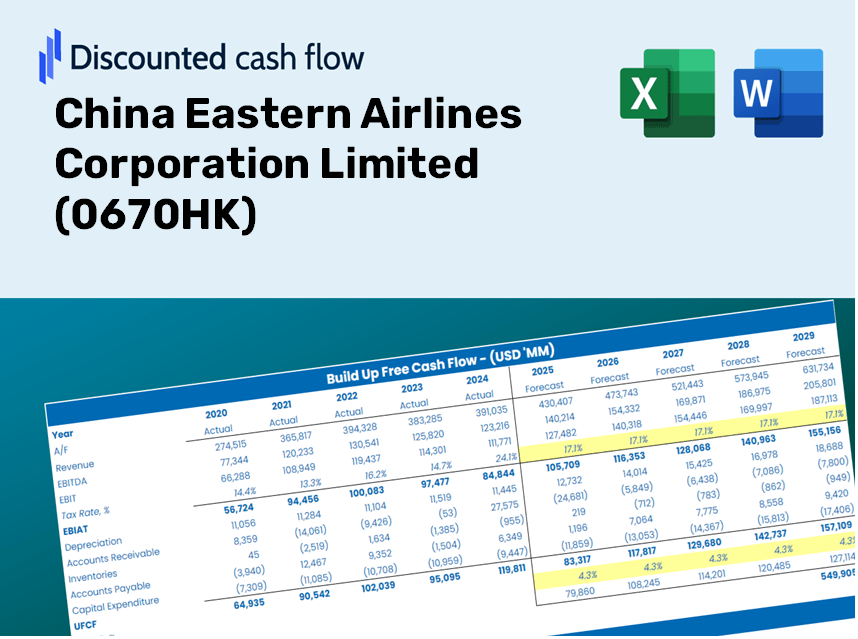
China Eastern Airlines Corporation Limited (0670.HK) Bundle
Aprimore suas opções de investimento com a calculadora DCF (0670HK)! Utilize dados financeiros autênticos da China Eastern Airlines, ajuste as previsões e despesas do crescimento e observe os efeitos imediatos dessas mudanças no valor intrínseco de (0670HK).
Discounted Cash Flow (DCF) - (USD MM)
| Year | AY1 2020 |
AY2 2021 |
AY3 2022 |
AY4 2023 |
AY5 2024 |
FY1 2025 |
FY2 2026 |
FY3 2027 |
FY4 2028 |
FY5 2029 |
|---|---|---|---|---|---|---|---|---|---|---|
| Revenue | 63,811.0 | 72,996.8 | 50,323.0 | 124,130.7 | 144,188.6 | 180,052.9 | 224,837.7 | 280,762.0 | 350,596.5 | 437,801.0 |
| Revenue Growth, % | 0 | 14.4 | -31.06 | 146.67 | 16.16 | 24.87 | 24.87 | 24.87 | 24.87 | 24.87 |
| EBITDA | 11,362.0 | 8,196.0 | -17,671.1 | 20,458.4 | 26,481.5 | 10,358.6 | 12,935.2 | 16,152.5 | 20,170.2 | 25,187.1 |
| EBITDA, % | 17.81 | 11.23 | -35.12 | 16.48 | 18.37 | 5.75 | 5.75 | 5.75 | 5.75 | 5.75 |
| Depreciation | 23,645.1 | 24,106.7 | 23,039.4 | 26,507.7 | 28,287.7 | 56,477.3 | 70,525.1 | 88,066.9 | 109,971.9 | 137,325.4 |
| Depreciation, % | 37.05 | 33.02 | 45.78 | 21.35 | 19.62 | 31.37 | 31.37 | 31.37 | 31.37 | 31.37 |
| EBIT | -12,283.1 | -15,910.7 | -40,710.5 | -6,049.3 | -1,806.2 | -46,118.7 | -57,589.9 | -71,914.3 | -89,801.7 | -112,138.3 |
| EBIT, % | -19.25 | -21.8 | -80.9 | -4.87 | -1.25 | -25.61 | -25.61 | -25.61 | -25.61 | -25.61 |
| Total Cash | 8,453.6 | 14,224.6 | 19,235.0 | 13,229.3 | 4,620.8 | 30,544.0 | 38,141.3 | 47,628.3 | 59,474.9 | 74,268.2 |
| Total Cash, percent | .0 | .0 | .0 | .0 | .0 | .0 | .0 | .0 | .0 | .0 |
| Account Receivables | 1,226.7 | 1,063.0 | 3,327.5 | 2,364.9 | 5,321.4 | 5,612.8 | 7,008.9 | 8,752.3 | 10,929.2 | 13,647.7 |
| Account Receivables, % | 1.92 | 1.46 | 6.61 | 1.91 | 3.69 | 3.12 | 3.12 | 3.12 | 3.12 | 3.12 |
| Inventories | 2,241.6 | 1,963.3 | 1,774.5 | 1,783.3 | 1,833.5 | 4,478.6 | 5,592.6 | 6,983.7 | 8,720.7 | 10,889.8 |
| Inventories, % | 3.51 | 2.69 | 3.53 | 1.44 | 1.27 | 2.49 | 2.49 | 2.49 | 2.49 | 2.49 |
| Accounts Payable | 3,782.6 | 3,692.0 | 3,929.9 | 5,894.4 | 27,204.0 | 15,272.3 | 19,071.0 | 23,814.5 | 29,737.9 | 37,134.7 |
| Accounts Payable, % | 5.93 | 5.06 | 7.81 | 4.75 | 18.87 | 8.48 | 8.48 | 8.48 | 8.48 | 8.48 |
| Capital Expenditure | -7,909.0 | -11,794.2 | -10,934.2 | -20,370.0 | -17,831.5 | -28,468.7 | -35,549.7 | -44,392.1 | -55,433.8 | -69,221.9 |
| Capital Expenditure, % | -12.39 | -16.16 | -21.73 | -16.41 | -12.37 | -15.81 | -15.81 | -15.81 | -15.81 | -15.81 |
| Tax Rate, % | -8.25 | -8.25 | -8.25 | -8.25 | -8.25 | -8.25 | -8.25 | -8.25 | -8.25 | -8.25 |
| EBITAT | -9,357.6 | -12,068.6 | -37,904.1 | -5,968.9 | -1,955.1 | -40,936.1 | -51,118.3 | -63,833.0 | -79,710.3 | -99,536.8 |
| Depreciation | ||||||||||
| Changes in Account Receivables | ||||||||||
| Changes in Inventories | ||||||||||
| Changes in Accounts Payable | ||||||||||
| Capital Expenditure | ||||||||||
| UFCF | 6,692.8 | 595.3 | -27,636.7 | 3,087.0 | 26,804.0 | -27,795.8 | -14,854.3 | -18,549.0 | -23,162.7 | -28,924.1 |
| WACC, % | 3.49 | 3.48 | 3.94 | 4.09 | 4.13 | 3.83 | 3.83 | 3.83 | 3.83 | 3.83 |
| PV UFCF | ||||||||||
| SUM PV UFCF | -101,024.4 | |||||||||
| Long Term Growth Rate, % | 2.00 | |||||||||
| Free cash flow (T + 1) | -29,503 | |||||||||
| Terminal Value | -1,613,930 | |||||||||
| Present Terminal Value | -1,337,558 | |||||||||
| Enterprise Value | -1,438,582 | |||||||||
| Net Debt | 153,929 | |||||||||
| Equity Value | -1,592,511 | |||||||||
| Diluted Shares Outstanding, MM | 20,075 | |||||||||
| Equity Value Per Share | -79.33 |
Benefits You Will Receive
- Flexible Forecast Parameters: Modify key assumptions (growth %, margins, WACC) to generate various scenarios effortlessly.
- Real-Time Market Data: China Eastern Airlines’ financial information pre-loaded to facilitate your analysis.
- Automated DCF Calculations: The template computes Net Present Value (NPV) and intrinsic value without any extra effort.
- Tailored and Professional Design: A sleek Excel model that caters to your valuation requirements.
- Engineered for Analysts and Investors: Perfect for evaluating projections, confirming strategies, and optimizing time efficiency.
Key Features
- Comprehensive DCF Calculator: Offers detailed unlevered and levered DCF valuation models tailored for China Eastern Airlines Corporation Limited (0670HK).
- WACC Calculator: Features a pre-configured Weighted Average Cost of Capital sheet with adjustable inputs.
- Customizable Forecast Assumptions: Easily alter growth rates, capital expenditures, and discount rates.
- Integrated Financial Ratios: Assess profitability, leverage, and efficiency ratios specifically for China Eastern Airlines Corporation Limited (0670HK).
- Visual Dashboard and Charts: Graphical representations that summarize essential valuation metrics for straightforward analysis.
How It Works
- Download the Template: Gain immediate access to the Excel-based CEA DCF Calculator.
- Input Your Assumptions: Modify the yellow-highlighted cells for growth rates, WACC, margins, and other variables.
- Instant Calculations: The model will automatically refresh to reflect China Eastern Airlines Corporation Limited's intrinsic value.
- Test Scenarios: Experiment with various assumptions to assess potential changes in valuation.
- Analyze and Decide: Leverage the results to inform your investment or financial analysis regarding CEA (0670HK).
Why Opt for This Calculator?
- Reliable Data: Utilizes authentic China Eastern Airlines financials for trustworthy valuation outcomes.
- Customizable: Modify essential factors such as growth assumptions, WACC, and tax rates to align with your forecasts.
- Time-Efficient: Pre-configured calculations mean you don't have to start from the ground up.
- Professional-Quality Tool: Tailored for investors, analysts, and financial consultants.
- User-Friendly: Designed with an intuitive interface and clear, step-by-step guidance for all users.
Who Should Use This Product?
- Investors: Assess the fair value of China Eastern Airlines Corporation Limited (0670HK) to inform your investment choices.
- CFOs: Utilize a high-quality DCF model for comprehensive financial reporting and analysis related to China Eastern Airlines Corporation Limited (0670HK).
- Consultants: Easily customize the template for valuation reports tailored to clients focused on China Eastern Airlines Corporation Limited (0670HK).
- Entrepreneurs: Discover financial modeling insights practiced by major airlines, applicable to China Eastern Airlines Corporation Limited (0670HK).
- Educators: Implement this resource as a teaching aid to explain valuation techniques using China Eastern Airlines Corporation Limited (0670HK) as a case study.
Contents of the Template
- Pre-Filled DCF Model: China Eastern Airlines’ financial data preloaded for immediate application.
- WACC Calculator: Comprehensive calculations for Weighted Average Cost of Capital.
- Financial Ratios: Assess China Eastern Airlines’ profitability, leverage, and operational efficiency.
- Editable Inputs: Modify assumptions such as growth, margins, and CAPEX to suit your scenarios.
- Financial Statements: Access annual and quarterly reports for in-depth analysis.
- Interactive Dashboard: Easily visualize essential valuation metrics and outcomes.
Disclaimer
All information, articles, and product details provided on this website are for general informational and educational purposes only. We do not claim any ownership over, nor do we intend to infringe upon, any trademarks, copyrights, logos, brand names, or other intellectual property mentioned or depicted on this site. Such intellectual property remains the property of its respective owners, and any references here are made solely for identification or informational purposes, without implying any affiliation, endorsement, or partnership.
We make no representations or warranties, express or implied, regarding the accuracy, completeness, or suitability of any content or products presented. Nothing on this website should be construed as legal, tax, investment, financial, medical, or other professional advice. In addition, no part of this site—including articles or product references—constitutes a solicitation, recommendation, endorsement, advertisement, or offer to buy or sell any securities, franchises, or other financial instruments, particularly in jurisdictions where such activity would be unlawful.
All content is of a general nature and may not address the specific circumstances of any individual or entity. It is not a substitute for professional advice or services. Any actions you take based on the information provided here are strictly at your own risk. You accept full responsibility for any decisions or outcomes arising from your use of this website and agree to release us from any liability in connection with your use of, or reliance upon, the content or products found herein.