
|
SHANDONG XINHUA Farmaceutical Company Limited (0719.HK) Avaliação DCF |
Totalmente Editável: Adapte-Se Às Suas Necessidades No Excel Ou Planilhas
Design Profissional: Modelos Confiáveis E Padrão Da Indústria
Pré-Construídos Para Uso Rápido E Eficiente
Compatível com MAC/PC, totalmente desbloqueado
Não É Necessária Experiência; Fácil De Seguir
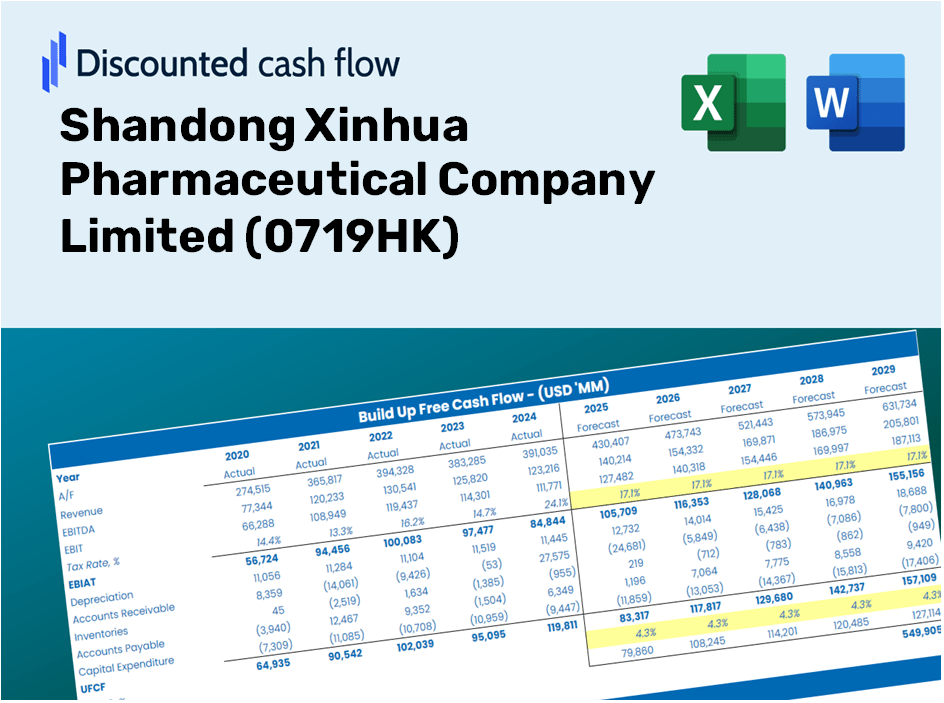
Shandong Xinhua Pharmaceutical Company Limited (0719.HK) Bundle
Descubra o verdadeiro valor da Shandong Xinhua Pharmaceutical Company Limited (0719HK) com nossa calculadora DCF avançada! Ajuste as principais suposições, explore vários cenários e avalie como as mudanças afetam a avaliação da SHANDONG XINHUA PHARMACEUTICAL Company Limited (0719HK) - tudo dentro de um único modelo do Excel.
Discounted Cash Flow (DCF) - (USD MM)
| Year | AY1 2020 |
AY2 2021 |
AY3 2022 |
AY4 2023 |
AY5 2024 |
FY1 2025 |
FY2 2026 |
FY3 2027 |
FY4 2028 |
FY5 2029 |
|---|---|---|---|---|---|---|---|---|---|---|
| Revenue | 6,554.2 | 7,159.3 | 8,188.4 | 8,840.8 | 9,239.7 | 10,073.2 | 10,982.0 | 11,972.7 | 13,052.9 | 14,230.4 |
| Revenue Growth, % | 0 | 9.23 | 14.37 | 7.97 | 4.51 | 9.02 | 9.02 | 9.02 | 9.02 | 9.02 |
| EBITDA | 935.1 | 917.0 | 1,103.2 | 1,190.4 | 1,216.1 | 1,353.3 | 1,475.4 | 1,608.5 | 1,753.6 | 1,911.8 |
| EBITDA, % | 14.27 | 12.81 | 13.47 | 13.46 | 13.16 | 13.43 | 13.43 | 13.43 | 13.43 | 13.43 |
| Depreciation | 416.2 | 474.0 | 529.1 | 564.2 | 590.4 | 648.8 | 707.3 | 771.1 | 840.7 | 916.5 |
| Depreciation, % | 6.35 | 6.62 | 6.46 | 6.38 | 6.39 | 6.44 | 6.44 | 6.44 | 6.44 | 6.44 |
| EBIT | 518.8 | 442.9 | 574.1 | 626.3 | 625.8 | 704.5 | 768.1 | 837.4 | 912.9 | 995.3 |
| EBIT, % | 7.92 | 6.19 | 7.01 | 7.08 | 6.77 | 6.99 | 6.99 | 6.99 | 6.99 | 6.99 |
| Total Cash | 933.9 | 812.7 | 1,264.6 | 1,002.2 | 1,358.8 | 1,351.6 | 1,473.5 | 1,606.4 | 1,751.3 | 1,909.3 |
| Total Cash, percent | .0 | .0 | .0 | .0 | .0 | .0 | .0 | .0 | .0 | .0 |
| Account Receivables | 565.9 | 950.0 | 1,059.3 | 1,035.9 | 1,232.3 | 1,206.6 | 1,315.5 | 1,434.2 | 1,563.6 | 1,704.6 |
| Account Receivables, % | 8.63 | 13.27 | 12.94 | 11.72 | 13.34 | 11.98 | 11.98 | 11.98 | 11.98 | 11.98 |
| Inventories | 1,227.1 | 1,121.4 | 1,322.7 | 1,432.9 | 1,389.1 | 1,647.6 | 1,796.2 | 1,958.3 | 2,135.0 | 2,327.6 |
| Inventories, % | 18.72 | 15.66 | 16.15 | 16.21 | 15.03 | 16.36 | 16.36 | 16.36 | 16.36 | 16.36 |
| Accounts Payable | 810.8 | 1,163.8 | 1,189.7 | 1,285.4 | 1,264.5 | 1,438.1 | 1,567.8 | 1,709.2 | 1,863.4 | 2,031.5 |
| Accounts Payable, % | 12.37 | 16.26 | 14.53 | 14.54 | 13.69 | 14.28 | 14.28 | 14.28 | 14.28 | 14.28 |
| Capital Expenditure | -305.8 | -272.0 | -267.1 | -354.8 | -231.8 | -367.7 | -400.8 | -437.0 | -476.4 | -519.4 |
| Capital Expenditure, % | -4.67 | -3.8 | -3.26 | -4.01 | -2.51 | -3.65 | -3.65 | -3.65 | -3.65 | -3.65 |
| Tax Rate, % | 11.92 | 11.92 | 11.92 | 11.92 | 11.92 | 11.92 | 11.92 | 11.92 | 11.92 | 11.92 |
| EBITAT | 409.4 | 366.5 | 500.2 | 583.7 | 551.2 | 606.0 | 660.7 | 720.3 | 785.3 | 856.1 |
| Depreciation | ||||||||||
| Changes in Account Receivables | ||||||||||
| Changes in Inventories | ||||||||||
| Changes in Accounts Payable | ||||||||||
| Capital Expenditure | ||||||||||
| UFCF | -462.3 | 643.2 | 477.5 | 802.0 | 736.1 | 827.8 | 839.4 | 915.1 | 997.7 | 1,087.7 |
| WACC, % | 4.14 | 4.18 | 4.21 | 4.26 | 4.22 | 4.2 | 4.2 | 4.2 | 4.2 | 4.2 |
| PV UFCF | ||||||||||
| SUM PV UFCF | 4,107.9 | |||||||||
| Long Term Growth Rate, % | 2.00 | |||||||||
| Free cash flow (T + 1) | 1,109 | |||||||||
| Terminal Value | 50,360 | |||||||||
| Present Terminal Value | 40,990 | |||||||||
| Enterprise Value | 45,098 | |||||||||
| Net Debt | 118 | |||||||||
| Equity Value | 44,981 | |||||||||
| Diluted Shares Outstanding, MM | 682 | |||||||||
| Equity Value Per Share | 65.91 |
What You Will Receive
- Customizable Excel Template: A fully editable Excel-based DCF Calculator featuring pre-populated financials for Shandong Xinhua Pharmaceutical Company Limited (0719HK).
- Accurate Data: Access to historical performance data and future projections (highlighted in the yellow cells).
- Adaptable Forecasting: Modify key assumptions such as revenue growth, EBITDA margin, and WACC according to your analysis.
- Instant Calculations: Observe how your inputs influence the valuation of Shandong Xinhua Pharmaceutical Company Limited (0719HK) in real-time.
- Professional Resource: Designed for investors, CFOs, consultants, and financial analysts.
- Intuitive Layout: Organized for simplicity and user-friendliness, complete with detailed step-by-step guidance.
Key Features
- Comprehensive Historical Data: Pre-loaded with Shandong Xinhua Pharmaceutical’s past financial performance and future projections.
- Customizable Parameters: Tailor revenue growth rates, profit margins, WACC, tax rates, and capital expenditures to your needs.
- Interactive Valuation Model: Automatically refreshes Net Present Value (NPV) and intrinsic value based on user inputs.
- Scenario Analysis: Generate various forecasting scenarios to explore different valuation results.
- Intuitive Interface: Designed for ease of use, suitable for both experienced professionals and newcomers.
How It Works
- Download the Template: Gain immediate access to the Excel-based (0719HK) DCF Calculator.
- Input Your Assumptions: Modify the yellow-highlighted cells for growth rates, WACC, margins, and other variables.
- Instant Calculations: The model automatically recalculates Shandong Xinhua Pharmaceutical's intrinsic value.
- Test Scenarios: Explore various assumptions to assess potential changes in valuation.
- Analyze and Decide: Utilize the results to inform your investment or financial decisions.
Why Opt for This Calculator?
- Precise Data: Authentic Shandong Xinhua Pharmaceutical financials guarantee dependable valuation outcomes.
- Tailorable: Modify essential parameters such as growth rates, WACC, and tax rates to align with your forecasts.
- Efficiency: Ready-made calculations save you the hassle of starting from the ground up.
- Professional Quality: Crafted for investors, analysts, and consultants alike.
- Accessible: User-friendly design and clear step-by-step guidance cater to all users.
Who Can Benefit from This Product?
- Professional Investors: Develop comprehensive and trustworthy valuation models for analyzing portfolios featuring Shandong Xinhua Pharmaceutical (0719HK).
- Corporate Finance Teams: Explore valuation scenarios to shape internal strategies for Shandong Xinhua Pharmaceutical (0719HK).
- Consultants and Advisors: Equip clients with precise valuation insights for Shandong Xinhua Pharmaceutical (0719HK).
- Students and Educators: Utilize real-world data to enhance skills in financial modeling related to Shandong Xinhua Pharmaceutical (0719HK).
- Pharma Enthusiasts: Gain insight into how companies like Shandong Xinhua Pharmaceutical (0719HK) are valued within the market.
Contents of the Template
- Historical Data: Contains Shandong Xinhua Pharmaceutical's previous financial results and foundational forecasts.
- DCF and Levered DCF Models: Comprehensive templates for assessing the intrinsic value of Shandong Xinhua Pharmaceutical (0719HK).
- WACC Sheet: Pre-configured calculations for the Weighted Average Cost of Capital.
- Editable Inputs: Adjust critical factors such as growth rates, EBITDA margins, and CAPEX estimates.
- Quarterly and Annual Statements: A thorough analysis of Shandong Xinhua Pharmaceutical's financials.
- Interactive Dashboard: Dynamically visualize valuation outcomes and forecasts.
Disclaimer
All information, articles, and product details provided on this website are for general informational and educational purposes only. We do not claim any ownership over, nor do we intend to infringe upon, any trademarks, copyrights, logos, brand names, or other intellectual property mentioned or depicted on this site. Such intellectual property remains the property of its respective owners, and any references here are made solely for identification or informational purposes, without implying any affiliation, endorsement, or partnership.
We make no representations or warranties, express or implied, regarding the accuracy, completeness, or suitability of any content or products presented. Nothing on this website should be construed as legal, tax, investment, financial, medical, or other professional advice. In addition, no part of this site—including articles or product references—constitutes a solicitation, recommendation, endorsement, advertisement, or offer to buy or sell any securities, franchises, or other financial instruments, particularly in jurisdictions where such activity would be unlawful.
All content is of a general nature and may not address the specific circumstances of any individual or entity. It is not a substitute for professional advice or services. Any actions you take based on the information provided here are strictly at your own risk. You accept full responsibility for any decisions or outcomes arising from your use of this website and agree to release us from any liability in connection with your use of, or reliance upon, the content or products found herein.