
|
Shenzhen Investment Holdings Bay Area Development Company Limited (0737.HK) Avaliação DCF |
Totalmente Editável: Adapte-Se Às Suas Necessidades No Excel Ou Planilhas
Design Profissional: Modelos Confiáveis E Padrão Da Indústria
Pré-Construídos Para Uso Rápido E Eficiente
Compatível com MAC/PC, totalmente desbloqueado
Não É Necessária Experiência; Fácil De Seguir
Shenzhen Investment Holdings Bay Area Development Company Limited (0737.HK) Bundle
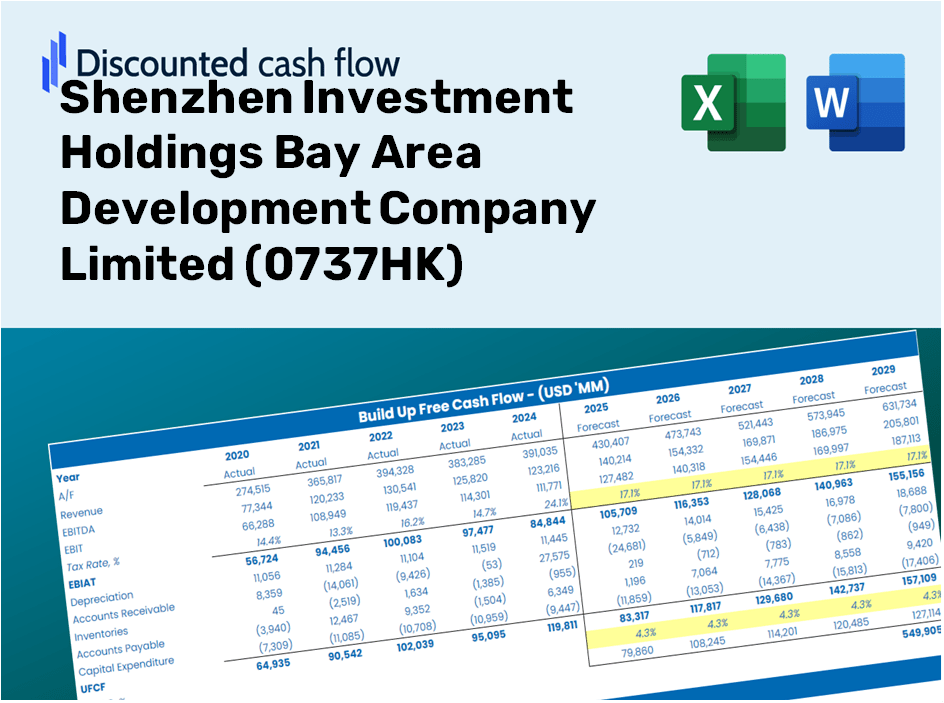
Procurando avaliar o valor intrínseco da Shenzhen Investment Holdings Bay Area Development Company Limited? Nossa calculadora DCF (0737HK) integra dados do mundo real com extensos recursos de personalização, permitindo refinar suas previsões e aprimorar suas opções de investimento.
Discounted Cash Flow (DCF) - (USD MM)
| Year | AY1 2020 |
AY2 2021 |
AY3 2022 |
AY4 2023 |
AY5 2024 |
FY1 2025 |
FY2 2026 |
FY3 2027 |
FY4 2028 |
FY5 2029 |
|---|---|---|---|---|---|---|---|---|---|---|
| Revenue | .0 | 670.8 | 863.4 | 1,033.0 | 961.6 | 1,061.2 | 1,171.2 | 1,292.6 | 1,426.5 | 1,574.3 |
| Revenue Growth, % | 0 | 0 | 28.72 | 19.64 | -6.91 | 10.36 | 10.36 | 10.36 | 10.36 | 10.36 |
| EBITDA | -38.5 | 1,333.1 | 785.9 | 500.0 | 610.0 | 855.1 | 943.7 | 1,041.4 | 1,149.3 | 1,268.4 |
| EBITDA, % | 100 | 198.73 | 91.02 | 48.41 | 63.43 | 80.57 | 80.57 | 80.57 | 80.57 | 80.57 |
| Depreciation | .6 | 241.0 | 201.6 | 250.4 | 295.9 | 454.9 | 502.0 | 554.0 | 611.4 | 674.7 |
| Depreciation, % | 100 | 35.93 | 23.35 | 24.24 | 30.78 | 42.86 | 42.86 | 42.86 | 42.86 | 42.86 |
| EBIT | -39.1 | 1,092.0 | 584.2 | 249.7 | 314.0 | 688.7 | 760.1 | 838.8 | 925.8 | 1,021.7 |
| EBIT, % | 100 | 162.8 | 67.66 | 24.17 | 32.66 | 64.9 | 64.9 | 64.9 | 64.9 | 64.9 |
| Total Cash | 1,706.3 | 2,418.0 | 1,011.9 | 1,106.3 | 1,211.0 | 1,061.2 | 1,171.2 | 1,292.6 | 1,426.5 | 1,574.3 |
| Total Cash, percent | .0 | .0 | .0 | .0 | .0 | .0 | .0 | .0 | .0 | .0 |
| Account Receivables | 36.2 | 164.5 | 146.0 | 155.2 | 158.1 | 367.0 | 405.0 | 446.9 | 493.2 | 544.4 |
| Account Receivables, % | 100 | 24.52 | 16.91 | 15.02 | 16.44 | 34.58 | 34.58 | 34.58 | 34.58 | 34.58 |
| Inventories | .4 | .6 | .5 | .2 | .2 | 212.6 | 234.7 | 259.0 | 285.8 | 315.4 |
| Inventories, % | 100 | 0.08589903 | 0.0540711 | 0.02243916 | 0.02592414 | 20.04 | 20.04 | 20.04 | 20.04 | 20.04 |
| Accounts Payable | 2,089.3 | 616.7 | 173.9 | 223.7 | 222.4 | 545.2 | 601.7 | 664.0 | 732.8 | 808.7 |
| Accounts Payable, % | 100 | 91.93 | 20.14 | 21.66 | 23.13 | 51.37 | 51.37 | 51.37 | 51.37 | 51.37 |
| Capital Expenditure | -1.2 | -.6 | -348.0 | -337.6 | -300.6 | -221.4 | -244.4 | -269.7 | -297.7 | -328.5 |
| Capital Expenditure, % | 100 | -0.08866997 | -40.3 | -32.68 | -31.26 | -20.87 | -20.87 | -20.87 | -20.87 | -20.87 |
| Tax Rate, % | 35.62 | 35.62 | 35.62 | 35.62 | 35.62 | 35.62 | 35.62 | 35.62 | 35.62 | 35.62 |
| EBITAT | -31.1 | 794.5 | 362.3 | 171.3 | 202.2 | 478.5 | 528.1 | 582.8 | 643.2 | 709.8 |
| Depreciation | ||||||||||
| Changes in Account Receivables | ||||||||||
| Changes in Inventories | ||||||||||
| Changes in Accounts Payable | ||||||||||
| Capital Expenditure | ||||||||||
| UFCF | 2,020.9 | -566.1 | -208.2 | 124.9 | 193.3 | 613.4 | 782.1 | 863.2 | 952.6 | 1,051.3 |
| WACC, % | 5.54 | 5.42 | 5.22 | 5.34 | 5.27 | 5.36 | 5.36 | 5.36 | 5.36 | 5.36 |
| PV UFCF | ||||||||||
| SUM PV UFCF | 3,607.7 | |||||||||
| Long Term Growth Rate, % | 2.00 | |||||||||
| Free cash flow (T + 1) | 1,072 | |||||||||
| Terminal Value | 31,920 | |||||||||
| Present Terminal Value | 24,586 | |||||||||
| Enterprise Value | 28,194 | |||||||||
| Net Debt | 4,159 | |||||||||
| Equity Value | 24,035 | |||||||||
| Diluted Shares Outstanding, MM | 3,082 | |||||||||
| Equity Value Per Share | 7.80 |
What You Will Receive
- Customizable Excel Template: An adaptable Excel-based DCF Calculator featuring pre-filled financial data for Shenzhen Investment Holdings Bay Area Development Company Limited (0737HK).
- Comprehensive Data: Access to historical data along with future projections (highlighted in the yellow cells).
- Assumption Flexibility: Modify forecasting variables such as revenue growth, EBITDA margin, and WACC.
- Instant Calculations: Quickly observe how your inputs affect the valuation of Shenzhen Investment Holdings Bay Area Development Company Limited (0737HK).
- Professional Resource: Designed for use by investors, CFOs, consultants, and financial analysts.
- User-Centric Layout: Organized for straightforwardness and user-friendliness, complete with detailed instructions.
Key Features
- Comprehensive DCF Calculator: Features extensive unlevered and levered DCF valuation frameworks.
- WACC Calculator: Integrated Weighted Average Cost of Capital model with adjustable parameters.
- Customizable Forecast Assumptions: Tailor growth rates, capital expenditures, and discount rates as needed.
- Integrated Financial Ratios: Evaluate profitability, leverage, and efficiency ratios specific to Shenzhen Investment Holdings Bay Area Development Company Limited (0737HK).
- Visual Dashboard and Charts: Graphical representations highlight essential valuation metrics for streamlined analysis.
How It Works
- Download: Get the comprehensive Excel file featuring Shenzhen Investment Holdings Bay Area Development Company Limited's (0737HK) financial data.
- Customize: Tailor your forecasts by modifying revenue growth rates, EBITDA percentages, and WACC.
- Update Automatically: Watch as intrinsic value and NPV calculations refresh in real-time.
- Test Scenarios: Develop various projections and instantly compare the results.
- Make Decisions: Leverage the valuation insights to inform your investment approach.
Why Choose This Calculator for Shenzhen Investment Holdings Bay Area Development Company Limited (0737HK)?
- Time Efficiency: Skip the hassle of building a DCF model from the ground up – it's ready for immediate use.
- Enhanced Accuracy: Dependable financial data and formulas minimize valuation errors.
- Completely Customizable: Adjust the model to align with your specific assumptions and forecasts.
- User-Friendly: Intuitive charts and outputs simplify the analysis of results.
- Endorsed by Professionals: Crafted for those who prioritize both precision and functionality.
Who Can Benefit from This Product?
- Investors: Accurately determine the fair value of Shenzhen Investment Holdings Bay Area Development Company Limited (0737HK) before making investment choices.
- CFOs: Utilize a high-caliber DCF model for comprehensive financial reporting and analysis.
- Consultants: Seamlessly customize the template for client valuation reports.
- Entrepreneurs: Obtain valuable insights into financial modeling practices employed by leading companies.
- Educators: Employ it as a resource for teaching valuation techniques and methodologies.
Contents of the Template
- Pre-Filled Data: Contains historical financials and projections for Shenzhen Investment Holdings Bay Area Development Company Limited (0737HK).
- Discounted Cash Flow Model: An adjustable DCF valuation model featuring automatic computation.
- Weighted Average Cost of Capital (WACC): A separate sheet for calculating WACC using user-defined inputs.
- Key Financial Ratios: Evaluate the profitability, efficiency, and leverage of Shenzhen Investment Holdings Bay Area Development Company Limited (0737HK).
- Customizable Inputs: Easily modify revenue growth, profit margins, and tax rates.
- Clear Dashboard: Visual representations and tables summarizing essential valuation outcomes.
Disclaimer
All information, articles, and product details provided on this website are for general informational and educational purposes only. We do not claim any ownership over, nor do we intend to infringe upon, any trademarks, copyrights, logos, brand names, or other intellectual property mentioned or depicted on this site. Such intellectual property remains the property of its respective owners, and any references here are made solely for identification or informational purposes, without implying any affiliation, endorsement, or partnership.
We make no representations or warranties, express or implied, regarding the accuracy, completeness, or suitability of any content or products presented. Nothing on this website should be construed as legal, tax, investment, financial, medical, or other professional advice. In addition, no part of this site—including articles or product references—constitutes a solicitation, recommendation, endorsement, advertisement, or offer to buy or sell any securities, franchises, or other financial instruments, particularly in jurisdictions where such activity would be unlawful.
All content is of a general nature and may not address the specific circumstances of any individual or entity. It is not a substitute for professional advice or services. Any actions you take based on the information provided here are strictly at your own risk. You accept full responsibility for any decisions or outcomes arising from your use of this website and agree to release us from any liability in connection with your use of, or reliance upon, the content or products found herein.