
|
China Tower Corporation Limited (0788.HK) Avaliação DCF |
Totalmente Editável: Adapte-Se Às Suas Necessidades No Excel Ou Planilhas
Design Profissional: Modelos Confiáveis E Padrão Da Indústria
Pré-Construídos Para Uso Rápido E Eficiente
Compatível com MAC/PC, totalmente desbloqueado
Não É Necessária Experiência; Fácil De Seguir
China Tower Corporation Limited (0788.HK) Bundle
Explore as perspectivas financeiras da China Tower Corporation Limited (0788HK) com nossa calculadora DCF! Basta inserir suas suposições de crescimento, margens e custos para calcular o valor intrínseco da China Tower Corporation Limited (0788HK) e informar suas decisões de investimento.
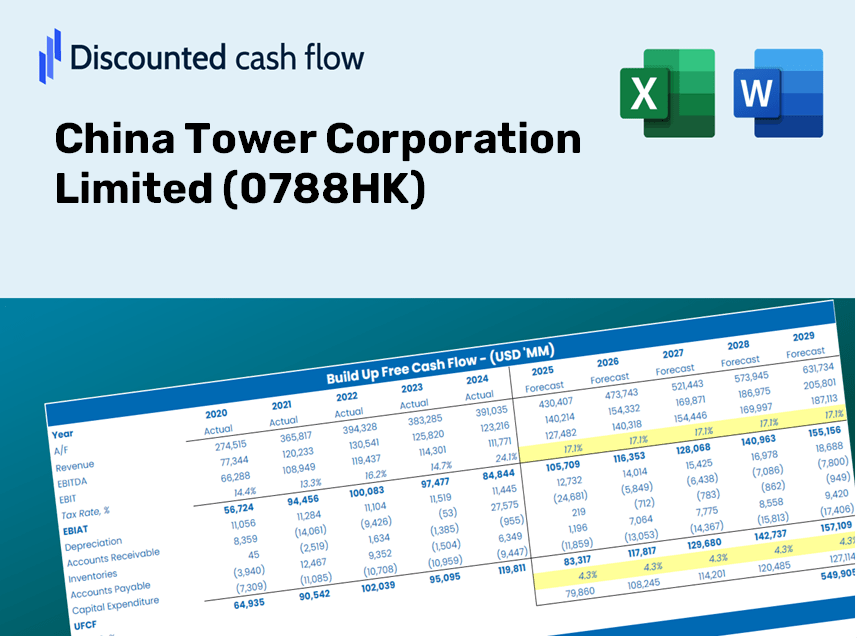
Discounted Cash Flow (DCF) - (USD MM)
| Year | AY1 2020 |
AY2 2021 |
AY3 2022 |
AY4 2023 |
AY5 2024 |
FY1 2025 |
FY2 2026 |
FY3 2027 |
FY4 2028 |
FY5 2029 |
|---|---|---|---|---|---|---|---|---|---|---|
| Revenue | 88,710.3 | 94,711.2 | 100,820.4 | 102,832.0 | 106,948.2 | 112,085.1 | 117,468.8 | 123,111.1 | 129,024.4 | 135,221.8 |
| Revenue Growth, % | 0 | 6.76 | 6.45 | 2 | 4 | 4.8 | 4.8 | 4.8 | 4.8 | 4.8 |
| EBITDA | 65,501.0 | 69,286.8 | 70,075.5 | 70,781.0 | 58,432.5 | 76,210.3 | 79,870.8 | 83,707.2 | 87,727.8 | 91,941.6 |
| EBITDA, % | 73.84 | 73.16 | 69.51 | 68.83 | 54.64 | 67.99 | 67.99 | 67.99 | 67.99 | 67.99 |
| Depreciation | 51,974.4 | 54,672.9 | 54,180.7 | 53,652.4 | 41,145.3 | 58,441.5 | 61,248.6 | 64,190.5 | 67,273.7 | 70,505.1 |
| Depreciation, % | 58.59 | 57.73 | 53.74 | 52.17 | 38.47 | 52.14 | 52.14 | 52.14 | 52.14 | 52.14 |
| EBIT | 13,526.6 | 14,613.9 | 15,894.8 | 17,128.6 | 17,287.2 | 17,768.7 | 18,622.2 | 19,516.7 | 20,454.1 | 21,436.6 |
| EBIT, % | 15.25 | 15.43 | 15.77 | 16.66 | 16.16 | 15.85 | 15.85 | 15.85 | 15.85 | 15.85 |
| Total Cash | 5,515.2 | 7,078.3 | 5,597.2 | 5,669.4 | 4,889.5 | 6,574.4 | 6,890.1 | 7,221.1 | 7,567.9 | 7,931.4 |
| Total Cash, percent | .0 | .0 | .0 | .0 | .0 | .0 | .0 | .0 | .0 | .0 |
| Account Receivables | 26,947.1 | 31,709.7 | 39,991.2 | 70,922.1 | 86,890.2 | 56,880.2 | 59,612.3 | 62,475.6 | 65,476.5 | 68,621.5 |
| Account Receivables, % | 30.38 | 33.48 | 39.67 | 68.97 | 81.25 | 50.75 | 50.75 | 50.75 | 50.75 | 50.75 |
| Inventories | 14,792.2 | 14,089.9 | 8,844.9 | -72,265.4 | .0 | -6,714.1 | -7,036.6 | -7,374.6 | -7,728.8 | -8,100.0 |
| Inventories, % | 16.67 | 14.88 | 8.77 | -70.28 | 0 | -5.99 | -5.99 | -5.99 | -5.99 | -5.99 |
| Accounts Payable | 34,412.6 | 27,635.1 | 29,146.8 | 30,940.7 | 36,391.4 | 36,090.4 | 37,824.0 | 39,640.7 | 41,544.8 | 43,540.2 |
| Accounts Payable, % | 38.79 | 29.18 | 28.91 | 30.09 | 34.03 | 32.2 | 32.2 | 32.2 | 32.2 | 32.2 |
| Capital Expenditure | -41,564.2 | -35,741.6 | -31,352.0 | -36,620.0 | -32,584.8 | -40,746.9 | -42,704.0 | -44,755.2 | -46,904.9 | -49,157.8 |
| Capital Expenditure, % | -46.85 | -37.74 | -31.1 | -35.61 | -30.47 | -36.35 | -36.35 | -36.35 | -36.35 | -36.35 |
| Tax Rate, % | 24.01 | 24.01 | 24.01 | 24.01 | 24.01 | 24.01 | 24.01 | 24.01 | 24.01 | 24.01 |
| EBITAT | 10,342.4 | 11,139.4 | 12,115.5 | 13,014.7 | 13,136.5 | 13,535.5 | 14,185.6 | 14,867.0 | 15,581.1 | 16,329.5 |
| Depreciation | ||||||||||
| Changes in Account Receivables | ||||||||||
| Changes in Inventories | ||||||||||
| Changes in Accounts Payable | ||||||||||
| Capital Expenditure | ||||||||||
| UFCF | 13,426.0 | 19,232.8 | 33,419.4 | 82,020.4 | -61,085.7 | 67,653.3 | 32,054.1 | 33,593.8 | 35,207.3 | 36,898.4 |
| WACC, % | 4.32 | 4.32 | 4.32 | 4.32 | 4.32 | 4.32 | 4.32 | 4.32 | 4.32 | 4.32 |
| PV UFCF | ||||||||||
| SUM PV UFCF | 183,494.0 | |||||||||
| Long Term Growth Rate, % | 2.00 | |||||||||
| Free cash flow (T + 1) | 37,636 | |||||||||
| Terminal Value | 1,622,854 | |||||||||
| Present Terminal Value | 1,313,588 | |||||||||
| Enterprise Value | 1,497,082 | |||||||||
| Net Debt | 98,389 | |||||||||
| Equity Value | 1,398,693 | |||||||||
| Diluted Shares Outstanding, MM | 17,481 | |||||||||
| Equity Value Per Share | 80.01 |
Benefits You Will Receive
- Authentic CTT Financial Data: Pre-filled with China Tower Corporation Limited's historical and forecasted data for accurate analysis.
- Customizable Template: Adjust essential inputs like revenue growth, WACC, and EBITDA % effortlessly.
- Instantaneous Calculations: Observe the intrinsic value of China Tower Corporation Limited update in real-time as you make changes.
- Professional Valuation Tool: Tailored for investors, analysts, and consultants in pursuit of precise DCF outcomes.
- Easy-to-Use Design: Intuitive layout and straightforward instructions suitable for all skill levels.
Key Features
- 🔍 Real-Life CTC Financials: Pre-filled historical and projected data for China Tower Corporation Limited (0788HK).
- ✏️ Fully Customizable Inputs: Adjust all critical parameters (yellow cells) such as WACC, growth %, and tax rates.
- 📊 Professional DCF Valuation: Integrated formulas compute China Tower’s intrinsic value using the Discounted Cash Flow method.
- ⚡ Instant Results: Visualize China Tower’s valuation immediately after making adjustments.
- Scenario Analysis: Evaluate and compare outcomes for different financial assumptions side-by-side.
How It Works
- 1. Access the Template: Download and open the Excel file containing China Tower Corporation Limited’s preloaded data.
- 2. Adjust Assumptions: Modify key inputs such as growth rates, WACC, and capital expenditures.
- 3. View Results Instantly: The DCF model automatically calculates intrinsic value and NPV based on your inputs.
- 4. Explore Scenarios: Analyze different valuation outcomes by comparing multiple forecasts.
- 5. Present with Confidence: Deliver professional valuation insights to bolster your decision-making process.
Why Choose This Calculator for China Tower Corporation Limited (0788HK)?
- User-Friendly Interface: Suitable for both newcomers and seasoned analysts.
- Customizable Inputs: Easily adjust parameters to align with your evaluations.
- Real-Time Updates: Observe immediate changes to China Tower’s valuation as you modify inputs.
- Preconfigured Data: Comes equipped with China Tower’s actual financial figures for swift assessments.
- Relied Upon by Experts: Favored by investors and analysts for making well-informed choices.
Who Should Utilize This Product?
- Investors: Assess China Tower Corporation Limited’s (0788HK) valuation prior to making investment decisions.
- CFOs and Financial Analysts: Optimize valuation procedures and evaluate financial projections.
- Startup Founders: Understand the valuation strategies of large public entities like China Tower Corporation Limited (0788HK).
- Consultants: Produce comprehensive valuation reports for clients based on China Tower Corporation Limited (0788HK) data.
- Students and Educators: Utilize real-time data to learn and instruct valuation methodologies.
Components of the Template
- In-Depth DCF Model: Editable template featuring comprehensive valuation computations.
- Current Financial Data: Historical and projected financial information for China Tower Corporation Limited (0788HK) preloaded for analysis.
- Modifiable Assumptions: Tailor WACC, growth rates, and tax considerations to explore different scenarios.
- Complete Financial Statements: Detailed annual and quarterly reports to gain deeper insights.
- Essential Ratios: Integrated analysis covering profitability, efficiency, and leverage metrics.
- Interactive Dashboard with Visuals: Graphs and tables presenting clear and actionable findings.
Disclaimer
All information, articles, and product details provided on this website are for general informational and educational purposes only. We do not claim any ownership over, nor do we intend to infringe upon, any trademarks, copyrights, logos, brand names, or other intellectual property mentioned or depicted on this site. Such intellectual property remains the property of its respective owners, and any references here are made solely for identification or informational purposes, without implying any affiliation, endorsement, or partnership.
We make no representations or warranties, express or implied, regarding the accuracy, completeness, or suitability of any content or products presented. Nothing on this website should be construed as legal, tax, investment, financial, medical, or other professional advice. In addition, no part of this site—including articles or product references—constitutes a solicitation, recommendation, endorsement, advertisement, or offer to buy or sell any securities, franchises, or other financial instruments, particularly in jurisdictions where such activity would be unlawful.
All content is of a general nature and may not address the specific circumstances of any individual or entity. It is not a substitute for professional advice or services. Any actions you take based on the information provided here are strictly at your own risk. You accept full responsibility for any decisions or outcomes arising from your use of this website and agree to release us from any liability in connection with your use of, or reliance upon, the content or products found herein.