
|
Xinhua Winshare Publishing and Media Co., Ltd. (0811.hk) Avaliação DCF |
Totalmente Editável: Adapte-Se Às Suas Necessidades No Excel Ou Planilhas
Design Profissional: Modelos Confiáveis E Padrão Da Indústria
Pré-Construídos Para Uso Rápido E Eficiente
Compatível com MAC/PC, totalmente desbloqueado
Não É Necessária Experiência; Fácil De Seguir
Xinhua Winshare Publishing and Media Co., Ltd. (0811.HK) Bundle
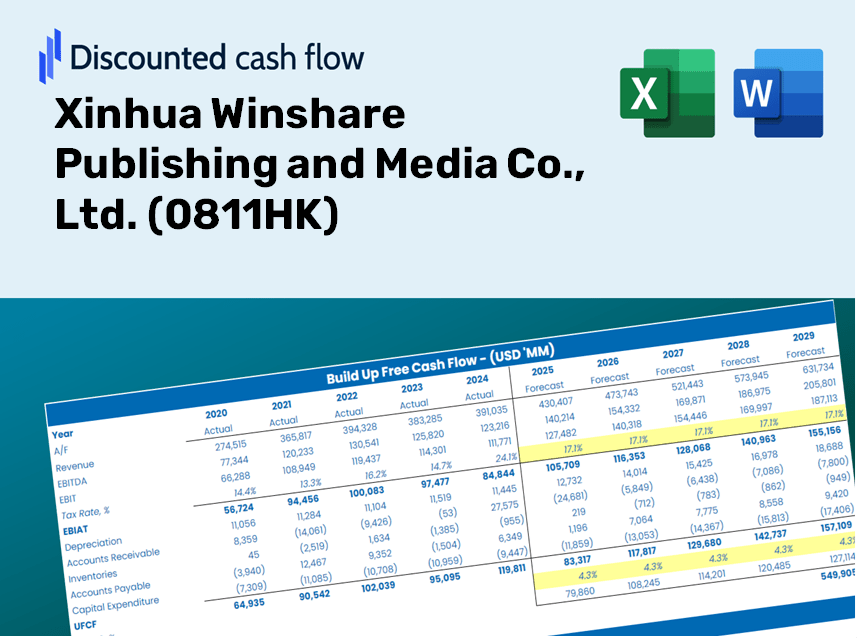
Explore o potencial financeiro do Xinhua Winshare Publishing and Media Co., Ltd. (0811HK) com a nossa calculadora DCF amigável! Digite suas projeções de crescimento, margens e despesas para calcular o valor intrínseco da Xinhua Winshare Publishing and Media Co., Ltd. (0811HK) e molde sua abordagem de investimento.
Discounted Cash Flow (DCF) - (USD MM)
| Year | AY1 2020 |
AY2 2021 |
AY3 2022 |
AY4 2023 |
AY5 2024 |
FY1 2025 |
FY2 2026 |
FY3 2027 |
FY4 2028 |
FY5 2029 |
|---|---|---|---|---|---|---|---|---|---|---|
| Revenue | 9,851.3 | 11,439.6 | 11,953.5 | 12,979.5 | 13,482.6 | 14,597.4 | 15,804.4 | 17,111.2 | 18,526.1 | 20,057.9 |
| Revenue Growth, % | 0 | 16.12 | 4.49 | 8.58 | 3.88 | 8.27 | 8.27 | 8.27 | 8.27 | 8.27 |
| EBITDA | 1,647.3 | 1,770.2 | 1,825.1 | 2,041.9 | 1,787.9 | 2,232.2 | 2,416.7 | 2,616.6 | 2,832.9 | 3,067.2 |
| EBITDA, % | 16.72 | 15.47 | 15.27 | 15.73 | 13.26 | 15.29 | 15.29 | 15.29 | 15.29 | 15.29 |
| Depreciation | 254.8 | 317.6 | 293.2 | 312.9 | 218.1 | 345.8 | 374.4 | 405.3 | 438.8 | 475.1 |
| Depreciation, % | 2.59 | 2.78 | 2.45 | 2.41 | 1.62 | 2.37 | 2.37 | 2.37 | 2.37 | 2.37 |
| EBIT | 1,392.5 | 1,452.6 | 1,531.9 | 1,729.1 | 1,569.8 | 1,886.4 | 2,042.4 | 2,211.2 | 2,394.1 | 2,592.0 |
| EBIT, % | 14.14 | 12.7 | 12.82 | 13.32 | 11.64 | 12.92 | 12.92 | 12.92 | 12.92 | 12.92 |
| Total Cash | 6,334.7 | 6,605.5 | 8,779.0 | 10,421.9 | 10,039.1 | 10,225.3 | 11,070.8 | 11,986.2 | 12,977.3 | 14,050.3 |
| Total Cash, percent | .0 | .0 | .0 | .0 | .0 | .0 | .0 | .0 | .0 | .0 |
| Account Receivables | 1,945.7 | 1,945.0 | 2,008.0 | 1,710.4 | 1,693.5 | 2,314.9 | 2,506.3 | 2,713.5 | 2,937.9 | 3,180.8 |
| Account Receivables, % | 19.75 | 17 | 16.8 | 13.18 | 12.56 | 15.86 | 15.86 | 15.86 | 15.86 | 15.86 |
| Inventories | 2,330.1 | 2,998.9 | 2,813.7 | 2,888.4 | 2,649.4 | 3,366.5 | 3,644.8 | 3,946.2 | 4,272.5 | 4,625.7 |
| Inventories, % | 23.65 | 26.21 | 23.54 | 22.25 | 19.65 | 23.06 | 23.06 | 23.06 | 23.06 | 23.06 |
| Accounts Payable | 5,026.2 | 5,962.2 | 5,932.2 | 5,982.1 | 5,968.4 | 7,098.0 | 7,684.9 | 8,320.3 | 9,008.3 | 9,753.1 |
| Accounts Payable, % | 51.02 | 52.12 | 49.63 | 46.09 | 44.27 | 48.62 | 48.62 | 48.62 | 48.62 | 48.62 |
| Capital Expenditure | -269.5 | -299.4 | -237.0 | -197.4 | -165.4 | -294.4 | -318.7 | -345.1 | -373.6 | -404.5 |
| Capital Expenditure, % | -2.74 | -2.62 | -1.98 | -1.52 | -1.23 | -2.02 | -2.02 | -2.02 | -2.02 | -2.02 |
| Tax Rate, % | 9.6 | 9.6 | 9.6 | 9.6 | 9.6 | 9.6 | 9.6 | 9.6 | 9.6 | 9.6 |
| EBITAT | 1,405.5 | 1,449.5 | 1,550.6 | 1,746.7 | 1,419.1 | 1,849.4 | 2,002.3 | 2,167.8 | 2,347.1 | 2,541.1 |
| Depreciation | ||||||||||
| Changes in Account Receivables | ||||||||||
| Changes in Inventories | ||||||||||
| Changes in Accounts Payable | ||||||||||
| Capital Expenditure | ||||||||||
| UFCF | 2,141.2 | 1,735.6 | 1,699.0 | 2,135.0 | 1,714.0 | 1,691.9 | 2,175.1 | 2,354.9 | 2,549.6 | 2,760.5 |
| WACC, % | 4.97 | 4.97 | 4.97 | 4.97 | 4.92 | 4.96 | 4.96 | 4.96 | 4.96 | 4.96 |
| PV UFCF | ||||||||||
| SUM PV UFCF | 9,890.2 | |||||||||
| Long Term Growth Rate, % | 2.00 | |||||||||
| Free cash flow (T + 1) | 2,816 | |||||||||
| Terminal Value | 95,068 | |||||||||
| Present Terminal Value | 74,624 | |||||||||
| Enterprise Value | 84,515 | |||||||||
| Net Debt | -9,747 | |||||||||
| Equity Value | 94,262 | |||||||||
| Diluted Shares Outstanding, MM | 1,236 | |||||||||
| Equity Value Per Share | 76.27 |
What You Will Receive
- Authentic Xinhua Winshare Data: Preloaded financial information – including revenue and EBIT – derived from actual and projected metrics.
- Comprehensive Customization: Modify all essential parameters (yellow cells) such as WACC, growth %, and tax rates.
- Real-Time Valuation Updates: Automatic recalculations to assess the effects of changes on Xinhua Winshare's fair value.
- Flexible Excel Template: Designed for easy modifications, scenario analysis, and thorough forecasting.
- Efficient and Precise: Eliminate the need to construct models from the ground up while ensuring accuracy and adaptability.
Key Features
- Customizable Forecast Inputs: Adjust essential metrics such as revenue growth, EBITDA %, and capital expenditures tailored for Xinhua Winshare Publishing and Media Co., Ltd. (0811HK).
- Instant DCF Valuation: Automatically computes intrinsic value, NPV, and other relevant financial metrics in real-time.
- High-Precision Accuracy: Leverages real-world financial data from Xinhua Winshare for trustworthy valuation results.
- Streamlined Scenario Analysis: Effortlessly evaluate various assumptions and analyze comparative outcomes.
- Efficiency Booster: Remove the hassle of constructing intricate valuation models from the ground up.
How It Works
- Step 1: Download the Excel file.
- Step 2: Review the provided data for Xinhua Winshare Publishing and Media Co., Ltd. (0811HK), including historical and projected metrics.
- Step 3: Modify the key assumptions (highlighted in yellow) based on your analysis and insights.
- Step 4: Observe the automatic recalculations reflecting Xinhua Winshare's intrinsic value.
- Step 5: Utilize the results to inform your investment decisions or reporting needs.
Why Select Xinhua Winshare Publishing and Media Co., Ltd. (0811HK)?
- Save Time: No need to build a financial model from the ground up – it’s ready for immediate use.
- Enhance Accuracy: Dependable financial data and calculations minimize valuation errors.
- Fully Customizable: Adjust the model to fit your specific assumptions and projections.
- Simple to Analyze: Intuitive charts and outputs ensure the results are easy to interpret.
- Endorsed by Professionals: Crafted for experts who prioritize both precision and user-friendliness.
Who Should Use This Product?
- Investors: Assess Xinhua Winshare's valuation before making stock transactions.
- CFOs and Financial Analysts: Optimize valuation workflows and evaluate financial forecasts.
- Startup Founders: Understand how large public companies like Xinhua Winshare are appraised.
- Consultants: Provide detailed valuation reports for your clients regarding Xinhua Winshare.
- Students and Educators: Use real-time data to teach and practice valuation methods related to Xinhua Winshare.
Contents of the Template
- Extensive DCF Model: Editable framework featuring in-depth valuation calculations.
- Historical Data: Preloaded financials for Xinhua Winshare Publishing and Media Co., Ltd. (0811HK) to facilitate analysis.
- Adjustable Parameters: Modify WACC, growth rates, and tax assumptions to explore different scenarios.
- Financial Statements: Comprehensive annual and quarterly breakdowns for enhanced insights.
- Key Financial Ratios: Integrated analysis for profitability, efficiency, and leverage metrics.
- Visual Dashboard: Charts and tables presenting clear, actionable insights.
Disclaimer
All information, articles, and product details provided on this website are for general informational and educational purposes only. We do not claim any ownership over, nor do we intend to infringe upon, any trademarks, copyrights, logos, brand names, or other intellectual property mentioned or depicted on this site. Such intellectual property remains the property of its respective owners, and any references here are made solely for identification or informational purposes, without implying any affiliation, endorsement, or partnership.
We make no representations or warranties, express or implied, regarding the accuracy, completeness, or suitability of any content or products presented. Nothing on this website should be construed as legal, tax, investment, financial, medical, or other professional advice. In addition, no part of this site—including articles or product references—constitutes a solicitation, recommendation, endorsement, advertisement, or offer to buy or sell any securities, franchises, or other financial instruments, particularly in jurisdictions where such activity would be unlawful.
All content is of a general nature and may not address the specific circumstances of any individual or entity. It is not a substitute for professional advice or services. Any actions you take based on the information provided here are strictly at your own risk. You accept full responsibility for any decisions or outcomes arising from your use of this website and agree to release us from any liability in connection with your use of, or reliance upon, the content or products found herein.