
|
OLAV THON EIEDOMSSELSKAP ASA (0FHP.L) DCF Avaliação |
Totalmente Editável: Adapte-Se Às Suas Necessidades No Excel Ou Planilhas
Design Profissional: Modelos Confiáveis E Padrão Da Indústria
Pré-Construídos Para Uso Rápido E Eficiente
Compatível com MAC/PC, totalmente desbloqueado
Não É Necessária Experiência; Fácil De Seguir
Olav Thon Eiendomsselskap ASA (0FHP.L) Bundle
Simplifique sua análise e melhore a precisão com a nossa calculadora DCF (0FHPL)! Com dados reais do OLAV THON EIDENDOMSSELSKAP ASA e suposições personalizáveis, essa ferramenta o capacita a prever, analisar e valorizar (0FHPL) como um investidor experiente.
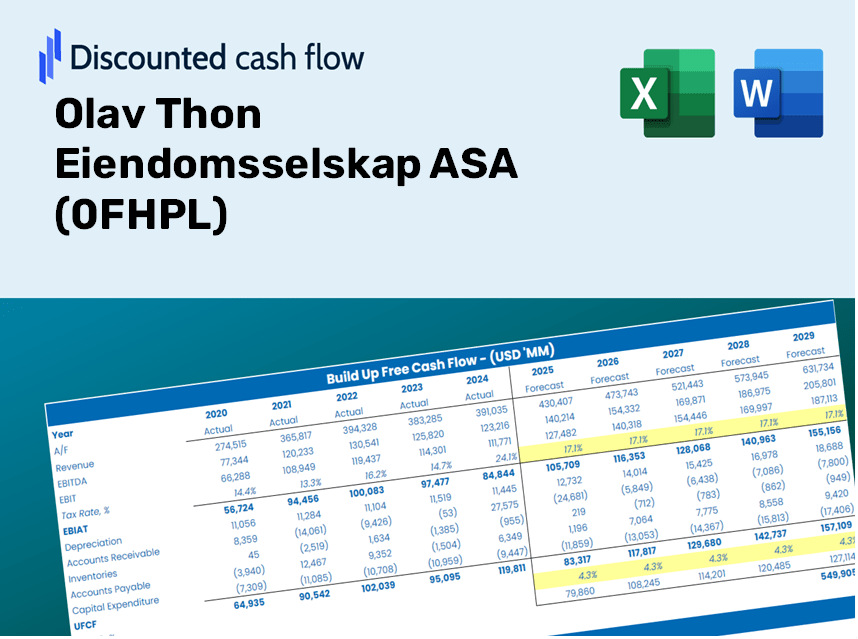
Discounted Cash Flow (DCF) - (USD MM)
| Year | AY1 2020 |
AY2 2021 |
AY3 2022 |
AY4 2023 |
AY5 2024 |
FY1 2025 |
FY2 2026 |
FY3 2027 |
FY4 2028 |
FY5 2029 |
|---|---|---|---|---|---|---|---|---|---|---|
| Revenue | 3,797.0 | 4,094.0 | 4,314.0 | 4,876.0 | 4,962.0 | 5,309.2 | 5,680.6 | 6,078.1 | 6,503.4 | 6,958.4 |
| Revenue Growth, % | 0 | 7.82 | 5.37 | 13.03 | 1.76 | 7 | 7 | 7 | 7 | 7 |
| EBITDA | 2,505.0 | 2,591.0 | 2,705.0 | 3,188.0 | 3,133.0 | 3,403.0 | 3,641.1 | 3,895.9 | 4,168.5 | 4,460.1 |
| EBITDA, % | 65.97 | 63.29 | 62.7 | 65.38 | 63.14 | 64.1 | 64.1 | 64.1 | 64.1 | 64.1 |
| Depreciation | 29.0 | 32.0 | 26.0 | 17.0 | 13.0 | 29.3 | 31.3 | 33.5 | 35.9 | 38.4 |
| Depreciation, % | 0.76376 | 0.78163 | 0.60269 | 0.34865 | 0.26199 | 0.55174 | 0.55174 | 0.55174 | 0.55174 | 0.55174 |
| EBIT | 2,476.0 | 2,559.0 | 2,679.0 | 3,171.0 | 3,120.0 | 3,373.7 | 3,609.8 | 3,862.3 | 4,132.6 | 4,421.7 |
| EBIT, % | 65.21 | 62.51 | 62.1 | 65.03 | 62.88 | 63.55 | 63.55 | 63.55 | 63.55 | 63.55 |
| Total Cash | 484.0 | 448.0 | 254.0 | 225.0 | 83.0 | 380.8 | 407.5 | 436.0 | 466.5 | 499.1 |
| Total Cash, percent | .0 | .0 | .0 | .0 | .0 | .0 | .0 | .0 | .0 | .0 |
| Account Receivables | 1,346.0 | 1,114.0 | 1,151.0 | 1,316.0 | 2,006.0 | 1,664.5 | 1,781.0 | 1,905.6 | 2,038.9 | 2,181.5 |
| Account Receivables, % | 35.45 | 27.21 | 26.68 | 26.99 | 40.43 | 31.35 | 31.35 | 31.35 | 31.35 | 31.35 |
| Inventories | .0 | -63,116.0 | -63,735.0 | .0 | .0 | -2,123.7 | -2,272.3 | -2,431.2 | -2,601.3 | -2,783.4 |
| Inventories, % | 0 | -1541.67 | -1477.4 | 0 | 0 | -40 | -40 | -40 | -40 | -40 |
| Accounts Payable | .0 | .0 | .0 | .0 | .0 | .0 | .0 | .0 | .0 | .0 |
| Accounts Payable, % | 0 | 0 | 0 | 0 | 0 | 0 | 0 | 0 | 0 | 0 |
| Capital Expenditure | -680.0 | -14.0 | -706.0 | -705.0 | -732.0 | -677.7 | -725.2 | -775.9 | -830.2 | -888.3 |
| Capital Expenditure, % | -17.91 | -0.34196 | -16.37 | -14.46 | -14.75 | -12.77 | -12.77 | -12.77 | -12.77 | -12.77 |
| Tax Rate, % | 21.97 | 21.97 | 21.97 | 21.97 | 21.97 | 21.97 | 21.97 | 21.97 | 21.97 | 21.97 |
| EBITAT | 2,300.7 | 2,023.8 | 2,096.0 | 2,283.9 | 2,434.5 | 2,701.0 | 2,890.0 | 3,092.2 | 3,308.5 | 3,540.0 |
| Depreciation | ||||||||||
| Changes in Account Receivables | ||||||||||
| Changes in Inventories | ||||||||||
| Changes in Accounts Payable | ||||||||||
| Capital Expenditure | ||||||||||
| UFCF | 303.7 | 65,389.8 | 1,998.0 | -62,304.1 | 1,025.5 | 4,517.7 | 2,228.3 | 2,384.2 | 2,551.0 | 2,729.5 |
| WACC, % | 4.87 | 4.65 | 4.64 | 4.54 | 4.63 | 4.67 | 4.67 | 4.67 | 4.67 | 4.67 |
| PV UFCF | ||||||||||
| SUM PV UFCF | 12,728.5 | |||||||||
| Long Term Growth Rate, % | 2.00 | |||||||||
| Free cash flow (T + 1) | 2,784 | |||||||||
| Terminal Value | 104,439 | |||||||||
| Present Terminal Value | 83,146 | |||||||||
| Enterprise Value | 95,874 | |||||||||
| Net Debt | 21,480 | |||||||||
| Equity Value | 74,394 | |||||||||
| Diluted Shares Outstanding, MM | 101 | |||||||||
| Equity Value Per Share | 733.10 |
What You Will Receive
- Modifiable Forecast Inputs: Flexibly adjust assumptions (growth %, margins, WACC) to generate various scenarios.
- Real-Life Data: Olav Thon Eiendomsselskap ASA’s financial information pre-filled to facilitate your analysis.
- Automated DCF Outputs: The model computes Net Present Value (NPV) and intrinsic value automatically.
- Customizable and Professional Design: A sleek Excel model that tailors itself to your valuation requirements.
- Designed for Analysts and Investors: Perfect for evaluating projections, confirming strategies, and enhancing efficiency.
Key Features
- Pre-Loaded Data: Historical financial statements and pre-filled forecasts for Olav Thon Eiendomsselskap ASA (0FHPL).
- Fully Adjustable Inputs: Customize WACC, tax rates, revenue growth, and EBITDA margins.
- Instant Results: View the intrinsic value of Olav Thon Eiendomsselskap ASA (0FHPL) recalculated in real time.
- Clear Visual Outputs: Dashboard charts present valuation results and key metrics clearly.
- Built for Accuracy: A professional tool tailored for analysts, investors, and finance professionals.
How It Operates
- Download the Template: Gain instant access to the Excel-based OTE DCF Calculator.
- Input Your Assumptions: Modify the yellow-highlighted cells for growth rates, WACC, margins, and other variables.
- Instant Calculations: The model will automatically refresh the intrinsic value of Olav Thon Eiendomsselskap ASA (0FHPL).
- Test Scenarios: Experiment with various assumptions to assess potential changes in valuation.
- Analyze and Decide: Utilize the outcomes to inform your investment or financial decisions.
Why Opt for This Calculator?
- Reliable Data: Authentic financials from Olav Thon Eiendomsselskap ASA (0FHPL) provide trustworthy valuation outcomes.
- Flexible Options: Tailor essential parameters such as growth rates, WACC, and tax rates to align with your forecasts.
- Efficient: Built-in calculations save you the effort of starting from the ground up.
- Expert-Level Tool: Crafted for investors, analysts, and consultants in the real estate sector.
- Easy to Use: User-friendly design with clear, step-by-step guidance ensures accessibility for everyone.
Who Can Benefit from Olav Thon Eiendomsselskap ASA (0FHPL)?
- Investors: Enhance your investment strategies with a top-tier valuation platform.
- Financial Analysts: Streamline your workflow with a customizable DCF model tailored for real estate.
- Consultants: Easily modify the template for impactful client presentations and reports.
- Real Estate Enthusiasts: Expand your knowledge of valuation methodologies through practical, industry-related examples.
- Educators and Students: Leverage this tool as a hands-on resource in real estate finance courses.
Contents of the Template
- Historical Data: Contains past financial information and baseline forecasts for Olav Thon Eiendomsselskap ASA (0FHPL).
- DCF and Levered DCF Models: Comprehensive templates designed to calculate the intrinsic value of Olav Thon Eiendomsselskap ASA (0FHPL).
- WACC Sheet: Pre-structured calculations for the Weighted Average Cost of Capital.
- Editable Inputs: Adjust key variables such as growth rates, EBITDA percentages, and CAPEX assumptions.
- Quarterly and Annual Statements: An exhaustive breakdown of Olav Thon Eiendomsselskap ASA's (0FHPL) financials.
- Interactive Dashboard: Dynamically visualize valuation outcomes and projections.
Disclaimer
All information, articles, and product details provided on this website are for general informational and educational purposes only. We do not claim any ownership over, nor do we intend to infringe upon, any trademarks, copyrights, logos, brand names, or other intellectual property mentioned or depicted on this site. Such intellectual property remains the property of its respective owners, and any references here are made solely for identification or informational purposes, without implying any affiliation, endorsement, or partnership.
We make no representations or warranties, express or implied, regarding the accuracy, completeness, or suitability of any content or products presented. Nothing on this website should be construed as legal, tax, investment, financial, medical, or other professional advice. In addition, no part of this site—including articles or product references—constitutes a solicitation, recommendation, endorsement, advertisement, or offer to buy or sell any securities, franchises, or other financial instruments, particularly in jurisdictions where such activity would be unlawful.
All content is of a general nature and may not address the specific circumstances of any individual or entity. It is not a substitute for professional advice or services. Any actions you take based on the information provided here are strictly at your own risk. You accept full responsibility for any decisions or outcomes arising from your use of this website and agree to release us from any liability in connection with your use of, or reliance upon, the content or products found herein.