
|
Vest Sparebanken (0G67.L) Avaliação DCF |
Totalmente Editável: Adapte-Se Às Suas Necessidades No Excel Ou Planilhas
Design Profissional: Modelos Confiáveis E Padrão Da Indústria
Pré-Construídos Para Uso Rápido E Eficiente
Compatível com MAC/PC, totalmente desbloqueado
Não É Necessária Experiência; Fácil De Seguir
Sparebanken Vest (0G67.L) Bundle
Aprimore suas opções de investimento com a calculadora DCF SpareBanken Vest (0G67L)! Utilize dados financeiros reais, ajuste as projeções e despesas de crescimento e observe instantaneamente como essas modificações afetam o valor intrínseco do colete Sparebanken.
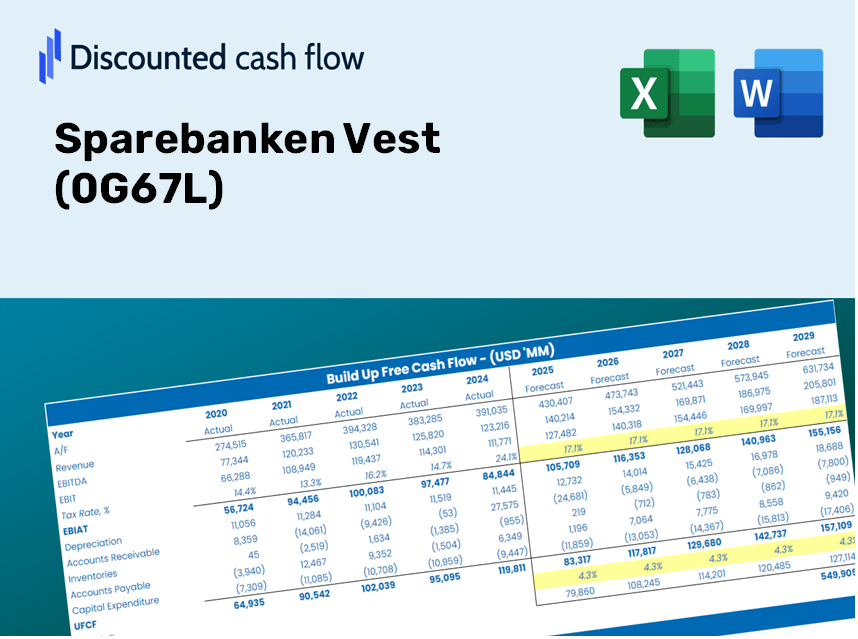
Discounted Cash Flow (DCF) - (USD MM)
| Year | AY1 2020 |
AY2 2021 |
AY3 2022 |
AY4 2023 |
AY5 2024 |
FY1 2025 |
FY2 2026 |
FY3 2027 |
FY4 2028 |
FY5 2029 |
|---|---|---|---|---|---|---|---|---|---|---|
| Revenue | 3,745.0 | 4,129.0 | 4,911.0 | 6,192.0 | 7,341.0 | 8,696.0 | 10,301.2 | 12,202.6 | 14,455.0 | 17,123.1 |
| Revenue Growth, % | 0 | 10.25 | 18.94 | 26.08 | 18.56 | 18.46 | 18.46 | 18.46 | 18.46 | 18.46 |
| EBITDA | 2,275.0 | 2,861.0 | 3,461.0 | 4,395.0 | .0 | 4,721.8 | 5,593.4 | 6,625.8 | 7,848.8 | 9,297.6 |
| EBITDA, % | 60.75 | 69.29 | 70.47 | 70.98 | 0 | 54.3 | 54.3 | 54.3 | 54.3 | 54.3 |
| Depreciation | 188.0 | 208.0 | 218.0 | 192.0 | 178.0 | 348.2 | 412.5 | 488.6 | 578.8 | 685.7 |
| Depreciation, % | 5.02 | 5.04 | 4.44 | 3.1 | 2.42 | 4 | 4 | 4 | 4 | 4 |
| EBIT | 2,087.0 | 2,653.0 | 3,243.0 | 4,203.0 | -178.0 | 4,373.6 | 5,180.9 | 6,137.2 | 7,270.0 | 8,611.9 |
| EBIT, % | 55.73 | 64.25 | 66.04 | 67.88 | -2.42 | 50.29 | 50.29 | 50.29 | 50.29 | 50.29 |
| Total Cash | 217.0 | 334.0 | 143.0 | 387.0 | 483.0 | 515.2 | 610.3 | 723.0 | 856.5 | 1,014.5 |
| Total Cash, percent | .0 | .0 | .0 | .0 | .0 | .0 | .0 | .0 | .0 | .0 |
| Account Receivables | .0 | .0 | .0 | .0 | .0 | .0 | .0 | .0 | .0 | .0 |
| Account Receivables, % | 0 | 0 | 0 | 0 | 0 | 0 | 0 | 0 | 0 | 0 |
| Inventories | .0 | .0 | .0 | .0 | .0 | .0 | .0 | .0 | .0 | .0 |
| Inventories, % | 0 | 0 | 0 | 0 | 0 | 0 | 0 | 0 | 0 | 0 |
| Accounts Payable | .0 | .0 | .0 | .0 | .0 | .0 | .0 | .0 | .0 | .0 |
| Accounts Payable, % | 0 | 0 | 0 | 0 | 0 | 0 | 0 | 0 | 0 | 0 |
| Capital Expenditure | -145.0 | -93.0 | -123.0 | -107.0 | -72.0 | -197.2 | -233.6 | -276.7 | -327.8 | -388.3 |
| Capital Expenditure, % | -3.87 | -2.25 | -2.5 | -1.73 | -0.98079 | -2.27 | -2.27 | -2.27 | -2.27 | -2.27 |
| Tax Rate, % | 17.51 | 17.51 | 17.51 | 17.51 | 17.51 | 17.51 | 17.51 | 17.51 | 17.51 | 17.51 |
| EBITAT | 1,773.8 | 2,182.3 | 2,607.2 | 3,372.5 | -146.8 | 3,589.6 | 4,252.1 | 5,037.0 | 5,966.7 | 7,068.1 |
| Depreciation | ||||||||||
| Changes in Account Receivables | ||||||||||
| Changes in Inventories | ||||||||||
| Changes in Accounts Payable | ||||||||||
| Capital Expenditure | ||||||||||
| UFCF | 1,816.8 | 2,297.3 | 2,702.2 | 3,457.5 | -40.8 | 3,740.6 | 4,431.0 | 5,248.9 | 6,217.8 | 7,365.5 |
| WACC, % | 6.61 | 6.61 | 6.61 | 6.61 | 6.61 | 6.61 | 6.61 | 6.61 | 6.61 | 6.61 |
| PV UFCF | ||||||||||
| SUM PV UFCF | 21,902.0 | |||||||||
| Long Term Growth Rate, % | 2.00 | |||||||||
| Free cash flow (T + 1) | 7,513 | |||||||||
| Terminal Value | 163,033 | |||||||||
| Present Terminal Value | 118,392 | |||||||||
| Enterprise Value | 140,294 | |||||||||
| Net Debt | -483 | |||||||||
| Equity Value | 140,777 | |||||||||
| Diluted Shares Outstanding, MM | 110 | |||||||||
| Equity Value Per Share | 1,283.70 |
What You Will Receive
- Customizable Excel Template: A fully adjustable Excel-based DCF Calculator featuring pre-populated financial data for Sparebanken Vest (0G67L).
- Accurate Data: Access to historical figures and forward-looking projections (highlighted in the yellow cells).
- Flexible Forecasting: Adjust key assumptions such as revenue growth, EBITDA %, and WACC as needed.
- Instant Calculations: Quickly observe how your inputs influence the valuation of Sparebanken Vest (0G67L).
- Professional Resource: Designed for use by investors, CFOs, consultants, and financial analysts.
- User-Centric Layout: Organized for simplicity and user-friendliness, complete with clear step-by-step instructions.
Key Features
- Authentic Sparebanken Vest Financials: Gain access to precise historical data and forward-looking projections.
- Adjustable Forecast Parameters: Modify highlighted cells for metrics such as WACC, growth rates, and profit margins.
- Real-Time Calculations: Automatic updates for DCF, Net Present Value (NPV), and cash flow assessments.
- User-Friendly Dashboard: Clear and intuitive charts and summaries to visualize your valuation outputs.
- Designed for All Users: A straightforward, user-friendly layout suitable for investors, CFOs, and consultants alike.
How It Works
- Step 1: Download the Excel file for Sparebanken Vest (0G67L).
- Step 2: Examine the pre-filled financial data and forecasts for Sparebanken Vest (0G67L).
- Step 3: Adjust key inputs such as revenue growth, WACC, and tax rates (highlighted cells) as needed.
- Step 4: Observe how the DCF model updates in real-time as you modify your assumptions.
- Step 5: Evaluate the results and use the insights to inform your investment decisions for Sparebanken Vest (0G67L).
Reasons to Choose This Calculator for Sparebanken Vest (0G67L)
- All-in-One Solution: Combines DCF, WACC, and financial ratio analyses into a single resource.
- Flexible Customization: Modify the highlighted cells to explore different scenarios.
- In-Depth Analysis: Automatically computes Sparebanken Vest's intrinsic value and Net Present Value.
- Ready-to-Use Data: Incorporates historical and projected data for reliable benchmarks.
- Expert-Level Tool: Perfect for financial analysts, investors, and business consultants.
Who Can Benefit from Sparebanken Vest (0G67L)?
- Investors: Empower your investment choices with a high-quality valuation tool tailored for informed decision-making.
- Financial Analysts: Streamline your workflow with a ready-to-use DCF model that can be easily customized to fit your needs.
- Consultants: Effortlessly modify the template for client presentations or detailed reports.
- Finance Enthusiasts: Enhance your knowledge of valuation methods through practical, real-world examples.
- Educators and Students: Utilize this resource as a hands-on learning aid in finance courses.
Contents of the Template
- Preloaded Sparebanken Vest Data: Historical and projected financial information, encompassing revenue, EBIT, and capital expenditures.
- DCF and WACC Models: Professional-grade spreadsheets designed for calculating intrinsic value and Weighted Average Cost of Capital.
- Editable Inputs: Yellow-highlighted cells that allow adjustments for revenue growth, tax rates, and discount rates.
- Financial Statements: Detailed annual and quarterly financial reports for in-depth analysis.
- Key Ratios: Ratios related to profitability, leverage, and efficiency for assessing performance.
- Dashboard and Charts: Visual representations of valuation results and underlying assumptions.
Disclaimer
All information, articles, and product details provided on this website are for general informational and educational purposes only. We do not claim any ownership over, nor do we intend to infringe upon, any trademarks, copyrights, logos, brand names, or other intellectual property mentioned or depicted on this site. Such intellectual property remains the property of its respective owners, and any references here are made solely for identification or informational purposes, without implying any affiliation, endorsement, or partnership.
We make no representations or warranties, express or implied, regarding the accuracy, completeness, or suitability of any content or products presented. Nothing on this website should be construed as legal, tax, investment, financial, medical, or other professional advice. In addition, no part of this site—including articles or product references—constitutes a solicitation, recommendation, endorsement, advertisement, or offer to buy or sell any securities, franchises, or other financial instruments, particularly in jurisdictions where such activity would be unlawful.
All content is of a general nature and may not address the specific circumstances of any individual or entity. It is not a substitute for professional advice or services. Any actions you take based on the information provided here are strictly at your own risk. You accept full responsibility for any decisions or outcomes arising from your use of this website and agree to release us from any liability in connection with your use of, or reliance upon, the content or products found herein.