
|
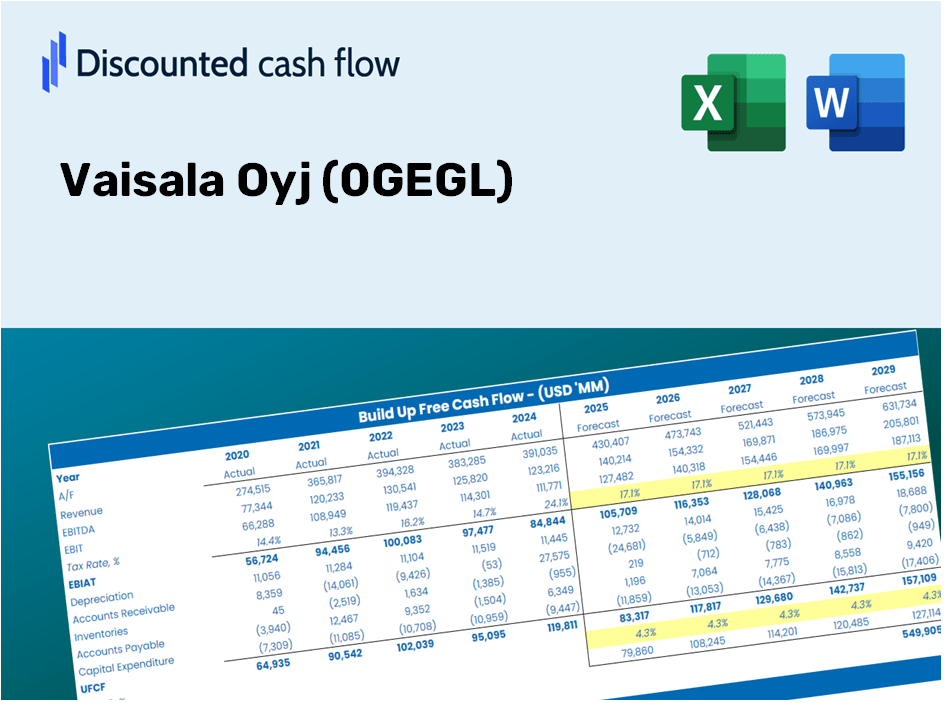
Vaisala Oyj (0GEG.L) Avaliação DCF |
Totalmente Editável: Adapte-Se Às Suas Necessidades No Excel Ou Planilhas
Design Profissional: Modelos Confiáveis E Padrão Da Indústria
Pré-Construídos Para Uso Rápido E Eficiente
Compatível com MAC/PC, totalmente desbloqueado
Não É Necessária Experiência; Fácil De Seguir
Vaisala Oyj (0GEG.L) Bundle
Simplifique a avaliação Vaisala Oyj (0GEGL) com esta calculadora DCF personalizável! Apresentando o Vaisala Oyj (0GEGL) e os insumos de previsão ajustáveis, você pode testar cenários e descobrir Vaisala Oyj (0GEGL) Valor justo em minutos.
Discounted Cash Flow (DCF) - (USD MM)
| Year | AY1 2020 |
AY2 2021 |
AY3 2022 |
AY4 2023 |
AY5 2024 |
FY1 2025 |
FY2 2026 |
FY3 2027 |
FY4 2028 |
FY5 2029 |
|---|---|---|---|---|---|---|---|---|---|---|
| Revenue | 379.5 | 437.9 | 514.2 | 540.4 | 564.7 | 624.6 | 690.8 | 764.0 | 845.0 | 934.6 |
| Revenue Growth, % | 0 | 15.39 | 17.42 | 5.1 | 4.5 | 10.6 | 10.6 | 10.6 | 10.6 | 10.6 |
| EBITDA | 63.0 | 71.1 | 84.5 | 90.3 | 107.7 | 106.2 | 117.5 | 130.0 | 143.7 | 159.0 |
| EBITDA, % | 16.6 | 16.24 | 16.43 | 16.71 | 19.07 | 17.01 | 17.01 | 17.01 | 17.01 | 17.01 |
| Depreciation | 20.6 | 21.7 | 23.6 | 24.3 | 24.3 | 29.7 | 32.8 | 36.3 | 40.2 | 44.4 |
| Depreciation, % | 5.43 | 4.96 | 4.59 | 4.5 | 4.3 | 4.75 | 4.75 | 4.75 | 4.75 | 4.75 |
| EBIT | 42.4 | 49.4 | 60.9 | 66.0 | 83.4 | 76.5 | 84.7 | 93.6 | 103.6 | 114.5 |
| EBIT, % | 11.17 | 11.28 | 11.84 | 12.21 | 14.77 | 12.26 | 12.26 | 12.26 | 12.26 | 12.26 |
| Total Cash | 45.4 | 77.9 | 55.5 | 90.3 | 88.8 | 91.2 | 100.8 | 111.5 | 123.3 | 136.4 |
| Total Cash, percent | .0 | .0 | .0 | .0 | .0 | .0 | .0 | .0 | .0 | .0 |
| Account Receivables | 82.9 | 95.7 | .0 | 111.5 | 134.8 | 110.2 | 121.9 | 134.8 | 149.1 | 164.9 |
| Account Receivables, % | 21.84 | 21.85 | 0 | 20.63 | 23.87 | 17.64 | 17.64 | 17.64 | 17.64 | 17.64 |
| Inventories | 44.5 | 49.9 | 61.6 | 58.8 | 57.8 | 70.2 | 77.7 | 85.9 | 95.0 | 105.1 |
| Inventories, % | 11.73 | 11.4 | 11.98 | 10.88 | 10.24 | 11.24 | 11.24 | 11.24 | 11.24 | 11.24 |
| Accounts Payable | 13.8 | 21.4 | 25.2 | 10.5 | 26.9 | 25.1 | 27.8 | 30.8 | 34.0 | 37.6 |
| Accounts Payable, % | 3.64 | 4.89 | 4.9 | 1.94 | 4.76 | 4.03 | 4.03 | 4.03 | 4.03 | 4.03 |
| Capital Expenditure | -31.0 | -19.2 | -13.7 | -13.9 | -84.8 | -41.0 | -45.3 | -50.1 | -55.4 | -61.3 |
| Capital Expenditure, % | -8.17 | -4.38 | -2.66 | -2.57 | -15.02 | -6.56 | -6.56 | -6.56 | -6.56 | -6.56 |
| Tax Rate, % | 21.16 | 21.16 | 21.16 | 21.16 | 21.16 | 21.16 | 21.16 | 21.16 | 21.16 | 21.16 |
| EBITAT | 33.7 | 39.9 | 46.0 | 51.1 | 65.7 | 60.0 | 66.4 | 73.4 | 81.2 | 89.8 |
| Depreciation | ||||||||||
| Changes in Account Receivables | ||||||||||
| Changes in Inventories | ||||||||||
| Changes in Accounts Payable | ||||||||||
| Capital Expenditure | ||||||||||
| UFCF | -90.3 | 31.8 | 143.7 | -61.9 | -.7 | 59.2 | 37.4 | 41.4 | 45.8 | 50.6 |
| WACC, % | 6.52 | 6.52 | 6.51 | 6.52 | 6.52 | 6.52 | 6.52 | 6.52 | 6.52 | 6.52 |
| PV UFCF | ||||||||||
| SUM PV UFCF | 195.3 | |||||||||
| Long Term Growth Rate, % | 3.50 | |||||||||
| Free cash flow (T + 1) | 52 | |||||||||
| Terminal Value | 1,736 | |||||||||
| Present Terminal Value | 1,266 | |||||||||
| Enterprise Value | 1,462 | |||||||||
| Net Debt | 41 | |||||||||
| Equity Value | 1,421 | |||||||||
| Diluted Shares Outstanding, MM | 36 | |||||||||
| Equity Value Per Share | 39.03 |
What You Will Receive
- Customizable Excel Template: A fully adaptable Excel-based DCF Calculator featuring pre-populated financial data for Vaisala Oyj (0GEGL).
- Authentic Data: Access to historical figures and future projections (highlighted in yellow cells).
- Flexible Forecasting: Adjust key assumptions such as revenue growth, EBITDA %, and WACC.
- Instant Calculations: Immediately observe how your inputs affect the valuation of Vaisala Oyj (0GEGL).
- Professional Resource: Designed for investors, CFOs, consultants, and financial analysts.
- User-Friendly Interface: Organized for simplicity and efficiency, complete with step-by-step guidance.
Key Features
- Comprehensive Historical Data: Vaisala Oyj's (0GEGL) past financial statements and automated forecasts.
- Customizable Variables: Adjust WACC, tax rates, revenue growth, and EBITDA margins as needed.
- Real-Time Calculations: Witness Vaisala Oyj's (0GEGL) intrinsic value update instantly.
- Intuitive Visualization: Dashboard graphs illustrate valuation outcomes and essential metrics.
- Designed for Precision: An expert-grade tool tailored for analysts, investors, and financial professionals.
How It Functions
- Download: Obtain the pre-configured Excel file containing Vaisala Oyj’s (0GEGL) financial data.
- Customize: Tailor forecasts, including revenue growth, EBITDA percentage, and WACC.
- Update Automatically: The intrinsic value and NPV calculations refresh in real-time.
- Test Scenarios: Generate multiple projections and quickly compare results.
- Make Decisions: Leverage the valuation outcomes to inform your investment strategy.
Why Select This Calculator for Vaisala Oyj (0GEGL)?
- User-Friendly Interface: Perfectly crafted for both novices and seasoned users.
- Customizable Inputs: Seamlessly adjust parameters to align with your analysis.
- Real-Time Adjustments: Observe immediate changes to Vaisala's valuation as you modify the inputs.
- Pre-Loaded Data: Comes equipped with Vaisala’s actual financial information for swift evaluations.
- Endorsed by Experts: A go-to tool for investors and analysts in making well-informed choices.
Who Can Benefit from This Product?
- Professional Investors: Create comprehensive and accurate valuation models for portfolio assessments related to Vaisala Oyj (0GEGL).
- Corporate Finance Teams: Evaluate valuation scenarios to inform strategic decisions within the organization.
- Consultants and Advisors: Equip clients with precise valuation analyses for Vaisala Oyj (0GEGL) stock.
- Students and Educators: Utilize real-world data to enhance learning and practice in financial modeling.
- Tech Enthusiasts: Gain insights into the valuation of technology companies like Vaisala Oyj (0GEGL) in the marketplace.
Overview of Template Features
- Preloaded Vaisala Oyj Data: Historical and projected financial metrics, including revenue, EBIT, and capital expenditures.
- DCF and WACC Models: Advanced spreadsheets for assessing intrinsic value and calculating Weighted Average Cost of Capital.
- Customizable Inputs: Yellow-highlighted cells available for modifying revenue growth, tax rates, and discount rates.
- Financial Statements: Detailed annual and quarterly financial reports for comprehensive analysis.
- Key Ratios: Metrics for profitability, leverage, and efficiency to measure performance.
- Dashboard and Charts: Visual representations of valuation results and underlying assumptions.
Disclaimer
All information, articles, and product details provided on this website are for general informational and educational purposes only. We do not claim any ownership over, nor do we intend to infringe upon, any trademarks, copyrights, logos, brand names, or other intellectual property mentioned or depicted on this site. Such intellectual property remains the property of its respective owners, and any references here are made solely for identification or informational purposes, without implying any affiliation, endorsement, or partnership.
We make no representations or warranties, express or implied, regarding the accuracy, completeness, or suitability of any content or products presented. Nothing on this website should be construed as legal, tax, investment, financial, medical, or other professional advice. In addition, no part of this site—including articles or product references—constitutes a solicitation, recommendation, endorsement, advertisement, or offer to buy or sell any securities, franchises, or other financial instruments, particularly in jurisdictions where such activity would be unlawful.
All content is of a general nature and may not address the specific circumstances of any individual or entity. It is not a substitute for professional advice or services. Any actions you take based on the information provided here are strictly at your own risk. You accept full responsibility for any decisions or outcomes arising from your use of this website and agree to release us from any liability in connection with your use of, or reliance upon, the content or products found herein.