
|
Samsung SDI Co Ltd (0l2t.l) Avaliação DCF |
Totalmente Editável: Adapte-Se Às Suas Necessidades No Excel Ou Planilhas
Design Profissional: Modelos Confiáveis E Padrão Da Indústria
Pré-Construídos Para Uso Rápido E Eficiente
Compatível com MAC/PC, totalmente desbloqueado
Não É Necessária Experiência; Fácil De Seguir
Samsung SDI Co., Ltd. (0L2T.L) Bundle
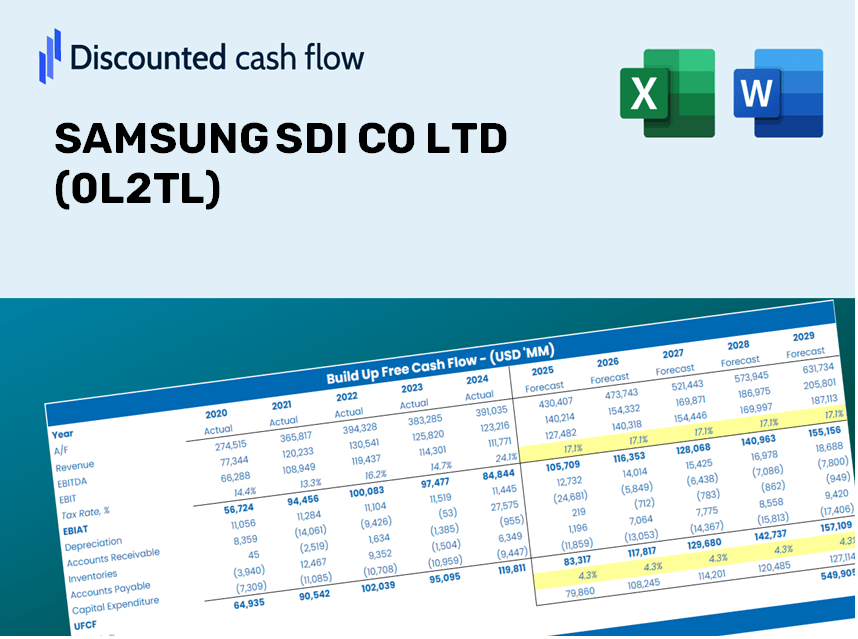
Simplifique a avaliação Samsung SDI Co Ltd (0L2TL) com esta calculadora DCF personalizável! Apresentando o Samsung SDI Co Ltd (0L2TL) e os insumos de previsão ajustáveis, você pode testar cenários e descobrir o valor justo da Samsung SDI Co Ltd (0L2TL) em minutos.
Discounted Cash Flow (DCF) - (USD MM)
| Year | AY1 2020 |
AY2 2021 |
AY3 2022 |
AY4 2023 |
AY5 2024 |
FY1 2025 |
FY2 2026 |
FY3 2027 |
FY4 2028 |
FY5 2029 |
|---|---|---|---|---|---|---|---|---|---|---|
| Revenue | 6,670.3 | 8,004.0 | 11,884.5 | 13,410.7 | 9,798.8 | 11,131.0 | 12,644.5 | 14,363.7 | 16,316.6 | 18,535.1 |
| Revenue Growth, % | 0 | 20 | 48.48 | 12.84 | -26.93 | 13.6 | 13.6 | 13.6 | 13.6 | 13.6 |
| EBITDA | 1,021.7 | 1,370.0 | 1,931.9 | 1,985.1 | 1,268.7 | 1,701.7 | 1,933.0 | 2,195.9 | 2,494.4 | 2,833.6 |
| EBITDA, % | 15.32 | 17.12 | 16.26 | 14.8 | 12.95 | 15.29 | 15.29 | 15.29 | 15.29 | 15.29 |
| Depreciation | 625.2 | 739.5 | 864.2 | 1,020.5 | 1,107.2 | 997.2 | 1,132.8 | 1,286.8 | 1,461.7 | 1,660.5 |
| Depreciation, % | 9.37 | 9.24 | 7.27 | 7.61 | 11.3 | 8.96 | 8.96 | 8.96 | 8.96 | 8.96 |
| EBIT | 396.5 | 630.5 | 1,067.7 | 964.6 | 161.5 | 704.5 | 800.3 | 909.1 | 1,032.7 | 1,173.1 |
| EBIT, % | 5.94 | 7.88 | 8.98 | 7.19 | 1.65 | 6.33 | 6.33 | 6.33 | 6.33 | 6.33 |
| Total Cash | 1,011.6 | 1,470.6 | 1,859.6 | 1,255.9 | 1,207.5 | 1,577.8 | 1,792.4 | 2,036.1 | 2,312.9 | 2,627.4 |
| Total Cash, percent | .0 | .0 | .0 | .0 | .0 | .0 | .0 | .0 | .0 | .0 |
| Account Receivables | 957.7 | 1,149.0 | 1,428.7 | 1,697.8 | 1,611.4 | 1,554.8 | 1,766.2 | 2,006.3 | 2,279.1 | 2,589.0 |
| Account Receivables, % | 14.36 | 14.36 | 12.02 | 12.66 | 16.45 | 13.97 | 13.97 | 13.97 | 13.97 | 13.97 |
| Inventories | 1,069.4 | 1,468.9 | 1,892.5 | 1,947.3 | 1,700.5 | 1,829.6 | 2,078.3 | 2,360.9 | 2,681.9 | 3,046.5 |
| Inventories, % | 16.03 | 18.35 | 15.92 | 14.52 | 17.35 | 16.44 | 16.44 | 16.44 | 16.44 | 16.44 |
| Accounts Payable | 821.9 | 751.1 | 1,294.2 | 1,251.2 | 534.8 | 1,054.9 | 1,198.3 | 1,361.2 | 1,546.3 | 1,756.6 |
| Accounts Payable, % | 12.32 | 9.38 | 10.89 | 9.33 | 5.46 | 9.48 | 9.48 | 9.48 | 9.48 | 9.48 |
| Capital Expenditure | -1,023.2 | -1,332.9 | -1,661.5 | -2,398.1 | -3,703.6 | -2,263.0 | -2,570.7 | -2,920.2 | -3,317.2 | -3,768.3 |
| Capital Expenditure, % | -15.34 | -16.65 | -13.98 | -17.88 | -37.8 | -20.33 | -20.33 | -20.33 | -20.33 | -20.33 |
| Tax Rate, % | -13.65 | -13.65 | -13.65 | -13.65 | -13.65 | -13.65 | -13.65 | -13.65 | -13.65 | -13.65 |
| EBITAT | 283.6 | 443.4 | 785.9 | 779.6 | 183.5 | 558.4 | 634.3 | 720.5 | 818.5 | 929.8 |
| Depreciation | ||||||||||
| Changes in Account Receivables | ||||||||||
| Changes in Inventories | ||||||||||
| Changes in Accounts Payable | ||||||||||
| Capital Expenditure | ||||||||||
| UFCF | -1,319.5 | -811.7 | -171.6 | -965.1 | -2,796.1 | -259.8 | -1,120.4 | -1,272.7 | -1,445.7 | -1,642.3 |
| WACC, % | 4.78 | 4.75 | 4.83 | 5.02 | 5.53 | 4.98 | 4.98 | 4.98 | 4.98 | 4.98 |
| PV UFCF | ||||||||||
| SUM PV UFCF | -4,842.0 | |||||||||
| Long Term Growth Rate, % | 2.00 | |||||||||
| Free cash flow (T + 1) | -1,675 | |||||||||
| Terminal Value | -56,176 | |||||||||
| Present Terminal Value | -44,053 | |||||||||
| Enterprise Value | -48,895 | |||||||||
| Net Debt | 5,820 | |||||||||
| Equity Value | -54,715 | |||||||||
| Diluted Shares Outstanding, MM | 67 | |||||||||
| Equity Value Per Share | -818.19 |
What You Will Receive
- Pre-Filled Financial Model: Leveraging Samsung SDI's actual data for accurate DCF valuation.
- Comprehensive Forecast Control: Modify revenue growth, profit margins, WACC, and other essential drivers.
- Real-Time Calculations: Immediate updates allow you to see results as you make adjustments.
- Investor-Ready Template: A polished Excel file crafted for top-tier valuation.
- Customizable and Reusable: Designed for adaptability, enabling repeated use for in-depth forecasts.
Key Features
- 🔍 Real-Life SSD Financials: Pre-filled historical and projected data for Samsung SDI Co. Ltd (0L2TL).
- ✏️ Fully Customizable Inputs: Modify all essential parameters (yellow cells) such as WACC, growth %, and tax rates.
- 📊 Professional DCF Valuation: Integrated formulas compute Samsung SDI’s intrinsic value using the Discounted Cash Flow method.
- ⚡ Instant Results: Visualize Samsung SDI’s valuation immediately after making adjustments.
- Scenario Analysis: Evaluate and compare results for different financial assumptions side-by-side.
How It Works
- 1. Access the Template: Download and open the Excel file featuring Samsung SDI Co. Ltd's preloaded data.
- 2. Modify Assumptions: Adjust key inputs such as growth rates, WACC, and capital expenditures.
- 3. View Instant Results: The DCF model automatically calculates intrinsic value and NPV in real-time.
- 4. Explore Scenarios: Evaluate various forecasts to assess different valuation possibilities.
- 5. Present with Confidence: Deliver professional valuation insights to guide your strategic decisions.
Why Opt for the Samsung SDI Calculator?
- Time-Saving: No need to build a DCF model from the ground up – it’s immediately available for use.
- Enhanced Accuracy: Dependable financial data and formulas minimize valuation errors.
- Completely Customizable: Adjust the model to align with your unique assumptions and forecasts.
- User-Friendly: Intuitive charts and outputs facilitate easy analysis of the results.
- Endorsed by Industry Leaders: Crafted for professionals who prioritize precision and ease of use.
Who Should Benefit from This Product?
- Professional Investors: Create comprehensive and dependable valuation models for analyzing investment portfolios.
- Corporate Finance Teams: Evaluate valuation scenarios to inform strategic decisions within the organization.
- Consultants and Advisors: Deliver precise valuation insights for Samsung SDI Co Ltd (0L2TL) to clients.
- Students and Educators: Leverage real-world data to enhance financial modeling skills and teaching methods.
- Tech Enthusiasts: Gain insights into the market valuation of technology companies like Samsung SDI Co Ltd (0L2TL).
Contents of the Template
- Comprehensive DCF Model: Editable template featuring thorough valuation calculations.
- Real-World Data: Samsung SDI Co Ltd’s (0L2TL) historical and projected financials preloaded for in-depth analysis.
- Customizable Parameters: Modify WACC, growth rates, and tax assumptions to explore different scenarios.
- Financial Statements: Complete annual and quarterly breakdowns for enhanced insights.
- Key Ratios: Integrated analysis focusing on profitability, efficiency, and leverage metrics.
- Dashboard with Visual Outputs: Charts and tables designed for clear, actionable results.
Disclaimer
All information, articles, and product details provided on this website are for general informational and educational purposes only. We do not claim any ownership over, nor do we intend to infringe upon, any trademarks, copyrights, logos, brand names, or other intellectual property mentioned or depicted on this site. Such intellectual property remains the property of its respective owners, and any references here are made solely for identification or informational purposes, without implying any affiliation, endorsement, or partnership.
We make no representations or warranties, express or implied, regarding the accuracy, completeness, or suitability of any content or products presented. Nothing on this website should be construed as legal, tax, investment, financial, medical, or other professional advice. In addition, no part of this site—including articles or product references—constitutes a solicitation, recommendation, endorsement, advertisement, or offer to buy or sell any securities, franchises, or other financial instruments, particularly in jurisdictions where such activity would be unlawful.
All content is of a general nature and may not address the specific circumstances of any individual or entity. It is not a substitute for professional advice or services. Any actions you take based on the information provided here are strictly at your own risk. You accept full responsibility for any decisions or outcomes arising from your use of this website and agree to release us from any liability in connection with your use of, or reliance upon, the content or products found herein.