
|
Sesa S.P.A. (0QHK.L) Avaliação DCF |
Totalmente Editável: Adapte-Se Às Suas Necessidades No Excel Ou Planilhas
Design Profissional: Modelos Confiáveis E Padrão Da Indústria
Pré-Construídos Para Uso Rápido E Eficiente
Compatível com MAC/PC, totalmente desbloqueado
Não É Necessária Experiência; Fácil De Seguir
SeSa S.p.A. (0QHK.L) Bundle
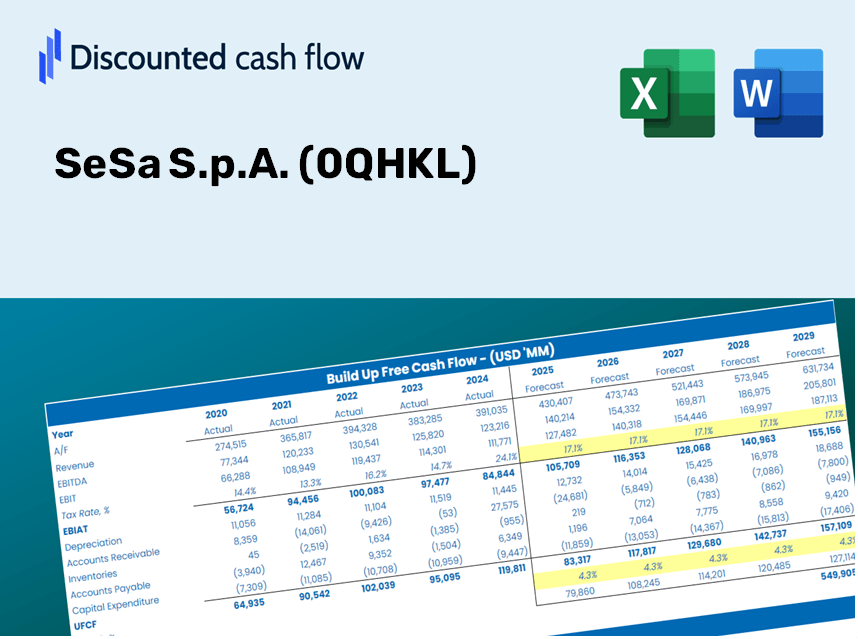
Seja você um investidor ou analista, esta calculadora DCF (0QHKL) é a ferramenta perfeita para uma avaliação precisa. Ele vem pré -carregado com dados reais da SESA S.P.A., permitindo ajustar as previsões e observar os efeitos em tempo real.
Discounted Cash Flow (DCF) - (USD MM)
| Year | AY1 2021 |
AY2 2022 |
AY3 2023 |
AY4 2024 |
AY5 2025 |
FY1 2026 |
FY2 2027 |
FY3 2028 |
FY4 2029 |
FY5 2030 |
|---|---|---|---|---|---|---|---|---|---|---|
| Revenue | 1,762.6 | 2,022.5 | 2,867.7 | 3,164.5 | 3,214.6 | 3,764.8 | 4,409.1 | 5,163.8 | 6,047.6 | 7,082.8 |
| Revenue Growth, % | 0 | 14.74 | 41.79 | 10.35 | 1.58 | 17.12 | 17.12 | 17.12 | 17.12 | 17.12 |
| EBITDA | 119.6 | 159.3 | 201.3 | 233.5 | 235.0 | 273.9 | 320.7 | 375.6 | 439.9 | 515.2 |
| EBITDA, % | 6.79 | 7.88 | 7.02 | 7.38 | 7.31 | 7.27 | 7.27 | 7.27 | 7.27 | 7.27 |
| Depreciation | 32.5 | 41.7 | 53.6 | 68.3 | 82.5 | 79.0 | 92.6 | 108.4 | 127.0 | 148.7 |
| Depreciation, % | 1.84 | 2.06 | 1.87 | 2.16 | 2.57 | 2.1 | 2.1 | 2.1 | 2.1 | 2.1 |
| EBIT | 87.2 | 117.6 | 147.6 | 165.2 | 152.6 | 194.8 | 228.2 | 267.2 | 313.0 | 366.5 |
| EBIT, % | 4.94 | 5.82 | 5.15 | 5.22 | 4.75 | 5.17 | 5.17 | 5.17 | 5.17 | 5.17 |
| Total Cash | 368.9 | 426.9 | 545.5 | 585.8 | 576.9 | 734.3 | 859.9 | 1,007.1 | 1,179.5 | 1,381.4 |
| Total Cash, percent | .0 | .0 | .0 | .0 | .0 | .0 | .0 | .0 | .0 | .0 |
| Account Receivables | 403.8 | 507.8 | .0 | 681.3 | 728.4 | 694.3 | 813.1 | 952.3 | 1,115.3 | 1,306.2 |
| Account Receivables, % | 22.91 | 25.11 | 0 | 21.53 | 22.66 | 18.44 | 18.44 | 18.44 | 18.44 | 18.44 |
| Inventories | 91.1 | 86.9 | 158.7 | 156.2 | 147.6 | 184.7 | 216.3 | 253.3 | 296.7 | 347.5 |
| Inventories, % | 5.17 | 4.3 | 5.54 | 4.93 | 4.59 | 4.91 | 4.91 | 4.91 | 4.91 | 4.91 |
| Accounts Payable | 366.1 | 525.9 | 586.1 | 638.0 | 595.1 | 797.2 | 933.7 | 1,093.5 | 1,280.7 | 1,499.9 |
| Accounts Payable, % | 20.77 | 26 | 20.44 | 20.16 | 18.51 | 21.18 | 21.18 | 21.18 | 21.18 | 21.18 |
| Capital Expenditure | -16.6 | -27.0 | -36.5 | -39.0 | -57.1 | -49.4 | -57.8 | -67.7 | -79.3 | -92.9 |
| Capital Expenditure, % | -0.94183 | -1.33 | -1.27 | -1.23 | -1.78 | -1.31 | -1.31 | -1.31 | -1.31 | -1.31 |
| Tax Rate, % | 37.48 | 37.48 | 37.48 | 37.48 | 37.48 | 37.48 | 37.48 | 37.48 | 37.48 | 37.48 |
| EBITAT | 54.9 | 76.1 | 97.2 | 106.1 | 95.4 | 124.8 | 146.1 | 171.2 | 200.5 | 234.8 |
| Depreciation | ||||||||||
| Changes in Account Receivables | ||||||||||
| Changes in Inventories | ||||||||||
| Changes in Accounts Payable | ||||||||||
| Capital Expenditure | ||||||||||
| UFCF | -58.0 | 150.7 | 610.5 | -491.5 | 39.4 | 353.6 | 166.9 | 195.5 | 228.9 | 268.1 |
| WACC, % | 9.04 | 9.1 | 9.14 | 9.09 | 9.02 | 9.08 | 9.08 | 9.08 | 9.08 | 9.08 |
| PV UFCF | ||||||||||
| SUM PV UFCF | 950.4 | |||||||||
| Long Term Growth Rate, % | 2.00 | |||||||||
| Free cash flow (T + 1) | 273 | |||||||||
| Terminal Value | 3,863 | |||||||||
| Present Terminal Value | 2,501 | |||||||||
| Enterprise Value | 3,452 | |||||||||
| Net Debt | -86 | |||||||||
| Equity Value | 3,538 | |||||||||
| Diluted Shares Outstanding, MM | 14 | |||||||||
| Equity Value Per Share | 258.15 |
What You Will Receive
- Authentic SeSa Data: Comprehensive financials – encompassing revenue through EBIT – derived from both actual and forecasted figures.
- Complete Customization: Modify essential parameters (highlighted cells) such as WACC, growth percentages, and tax rates.
- Immediate Valuation Updates: Automated recalculations to evaluate the effects of adjustments on SeSa’s fair value.
- Flexible Excel Template: Designed for swift modifications, scenario analysis, and in-depth projections.
- Efficient and Precise: Eliminate the need to construct models from the ground up while ensuring accuracy and adaptability.
Key Features
- Genuine SeSa Financial Data: Access reliable historical figures and future forecasts pre-loaded for your convenience.
- Adaptable Forecast Inputs: Modify the yellow-highlighted cells to adjust WACC, growth rates, and profit margins as needed.
- Real-time Calculations: Enjoy automatic updates to DCF, Net Present Value (NPV), and cash flow assessments.
- User-Friendly Dashboard: Intuitive charts and summaries to help you interpret your valuation findings effortlessly.
- Designed for All Skill Levels: A straightforward, user-centric layout tailored for investors, CFOs, and consultants alike.
How It Works
- Download: Obtain the pre-configured Excel file containing SeSa S.p.A.’s (0QHKL) financial data.
- Customize: Modify forecasts, including revenue growth, EBITDA %, and WACC to fit your analysis.
- Update Automatically: Watch as the intrinsic value and NPV calculations refresh in real-time.
- Test Scenarios: Generate various projections and analyze different outcomes instantly.
- Make Decisions: Leverage the valuation findings to inform your investment strategy.
Why Select This Calculator for SeSa S.p.A. (0QHKL)?
- Designed for Experts: An advanced instrument favored by analysts, CFOs, and consultants.
- Accurate Data: SeSa S.p.A.'s historical and projected financials are preloaded for precision.
- Scenario Analysis: Effortlessly test various forecasts and assumptions.
- Clear Results: Automatically computes intrinsic value, NPV, and essential metrics.
- User-Friendly: Detailed, step-by-step guidance to simplify your experience.
Who Can Benefit from This Product?
- Individual Investors: Gain insights to make informed choices regarding buying or selling SeSa S.p.A. (0QHKL) stock.
- Financial Analysts: Optimize valuation tasks with ready-to-apply financial models tailored for SeSa S.p.A. (0QHKL).
- Consultants: Provide clients with accurate and timely valuation analysis for SeSa S.p.A. (0QHKL).
- Business Owners: Learn the valuation strategies of major companies like SeSa S.p.A. (0QHKL) to inform your business plans.
- Finance Students: Explore valuation methodologies using real data and case studies from SeSa S.p.A. (0QHKL).
Contents of the Template
- Historical Data: Features SeSa S.p.A. (0QHKL)’s previous financial performance and baseline forecasts.
- DCF and Levered DCF Models: Comprehensive templates designed to assess SeSa S.p.A. (0QHKL)’s intrinsic value.
- WACC Sheet: Pre-calculated metrics for Weighted Average Cost of Capital.
- Editable Inputs: Customize essential parameters such as growth rates, EBITDA %, and CAPEX projections.
- Quarterly and Annual Statements: A thorough overview of SeSa S.p.A. (0QHKL)’s financials.
- Interactive Dashboard: Dynamically visualize valuation outcomes and future forecasts.
Disclaimer
All information, articles, and product details provided on this website are for general informational and educational purposes only. We do not claim any ownership over, nor do we intend to infringe upon, any trademarks, copyrights, logos, brand names, or other intellectual property mentioned or depicted on this site. Such intellectual property remains the property of its respective owners, and any references here are made solely for identification or informational purposes, without implying any affiliation, endorsement, or partnership.
We make no representations or warranties, express or implied, regarding the accuracy, completeness, or suitability of any content or products presented. Nothing on this website should be construed as legal, tax, investment, financial, medical, or other professional advice. In addition, no part of this site—including articles or product references—constitutes a solicitation, recommendation, endorsement, advertisement, or offer to buy or sell any securities, franchises, or other financial instruments, particularly in jurisdictions where such activity would be unlawful.
All content is of a general nature and may not address the specific circumstances of any individual or entity. It is not a substitute for professional advice or services. Any actions you take based on the information provided here are strictly at your own risk. You accept full responsibility for any decisions or outcomes arising from your use of this website and agree to release us from any liability in connection with your use of, or reliance upon, the content or products found herein.