
|
Rede de zelo SE (0QJQ.L) Avaliação DCF |
Totalmente Editável: Adapte-Se Às Suas Necessidades No Excel Ou Planilhas
Design Profissional: Modelos Confiáveis E Padrão Da Indústria
Pré-Construídos Para Uso Rápido E Eficiente
Compatível com MAC/PC, totalmente desbloqueado
Não É Necessária Experiência; Fácil De Seguir
ZEAL Network SE (0QJQ.L) Bundle
Aprimore suas estratégias de investimento com a calculadora DCF da rede de zelo SE (0QJQL)! Utilize dados financeiros genuínos, ajuste as previsões e despesas do crescimento e observe instantaneamente como essas modificações afetam o valor intrínseco da rede de zelo SE.
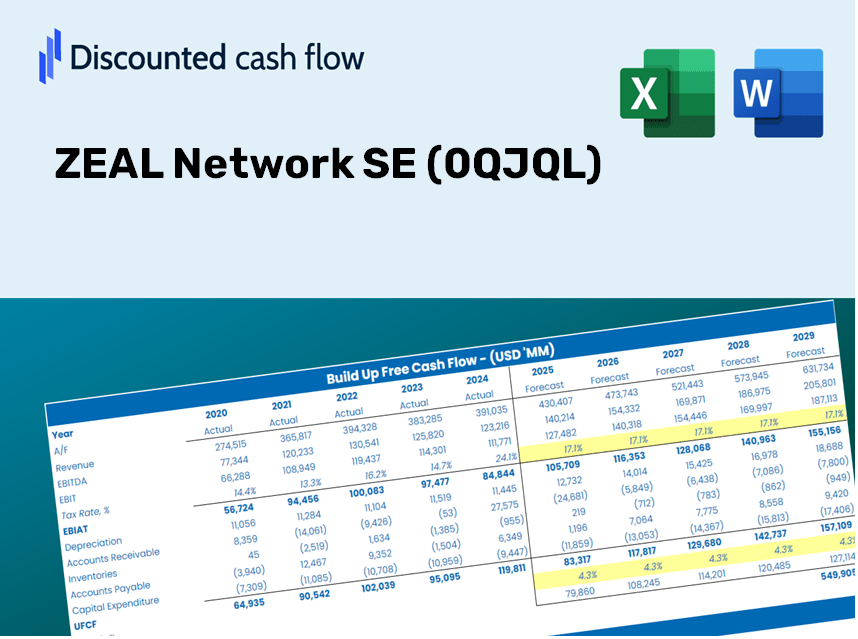
Discounted Cash Flow (DCF) - (USD MM)
| Year | AY1 2020 |
AY2 2021 |
AY3 2022 |
AY4 2023 |
AY5 2024 |
FY1 2025 |
FY2 2026 |
FY3 2027 |
FY4 2028 |
FY5 2029 |
|---|---|---|---|---|---|---|---|---|---|---|
| Revenue | 87.0 | 83.6 | 105.2 | 116.1 | 188.2 | 232.6 | 287.5 | 355.3 | 439.2 | 542.8 |
| Revenue Growth, % | 0 | -3.94 | 25.85 | 10.31 | 62.17 | 23.6 | 23.6 | 23.6 | 23.6 | 23.6 |
| EBITDA | 20.6 | 26.8 | 32.2 | 33.1 | 61.9 | 68.8 | 85.0 | 105.1 | 129.9 | 160.5 |
| EBITDA, % | 23.68 | 32.11 | 30.65 | 28.53 | 32.88 | 29.57 | 29.57 | 29.57 | 29.57 | 29.57 |
| Depreciation | 12.0 | 8.7 | 8.7 | 9.3 | 8.2 | 20.8 | 25.7 | 31.8 | 39.3 | 48.6 |
| Depreciation, % | 13.74 | 10.39 | 8.3 | 7.98 | 4.35 | 8.95 | 8.95 | 8.95 | 8.95 | 8.95 |
| EBIT | 8.6 | 18.2 | 23.5 | 23.9 | 53.7 | 48.0 | 59.3 | 73.3 | 90.5 | 111.9 |
| EBIT, % | 9.94 | 21.71 | 22.35 | 20.56 | 28.52 | 20.62 | 20.62 | 20.62 | 20.62 | 20.62 |
| Total Cash | 85.9 | 93.3 | 66.6 | 58.1 | 114.9 | 173.6 | 214.6 | 265.2 | 327.8 | 405.1 |
| Total Cash, percent | .0 | .0 | .0 | .0 | .0 | .0 | .0 | .0 | .0 | .0 |
| Account Receivables | 17.1 | 25.6 | 17.4 | 29.3 | 43.4 | 53.5 | 66.2 | 81.8 | 101.1 | 124.9 |
| Account Receivables, % | 19.69 | 30.57 | 16.53 | 25.21 | 23.04 | 23.01 | 23.01 | 23.01 | 23.01 | 23.01 |
| Inventories | 1.1 | .0 | 53.0 | 2.7 | 3.2 | 25.9 | 32.0 | 39.5 | 48.9 | 60.4 |
| Inventories, % | 1.25 | 0 | 50.39 | 2.29 | 1.68 | 11.12 | 11.12 | 11.12 | 11.12 | 11.12 |
| Accounts Payable | 3.6 | 3.7 | 3.8 | 3.6 | 12.2 | 10.1 | 12.5 | 15.5 | 19.1 | 23.6 |
| Accounts Payable, % | 4.15 | 4.43 | 3.6 | 3.11 | 6.46 | 4.35 | 4.35 | 4.35 | 4.35 | 4.35 |
| Capital Expenditure | -.6 | -.4 | -1.4 | -.4 | -.6 | -1.5 | -1.8 | -2.3 | -2.8 | -3.5 |
| Capital Expenditure, % | -0.73659 | -0.48091 | -1.36 | -0.33003 | -0.29437 | -0.64005 | -0.64005 | -0.64005 | -0.64005 | -0.64005 |
| Tax Rate, % | -15.68 | -15.68 | -15.68 | -15.68 | -15.68 | -15.68 | -15.68 | -15.68 | -15.68 | -15.68 |
| EBITAT | 9.0 | 11.8 | 16.5 | 13.7 | 62.1 | 37.6 | 46.5 | 57.5 | 71.0 | 87.8 |
| Depreciation | ||||||||||
| Changes in Account Receivables | ||||||||||
| Changes in Inventories | ||||||||||
| Changes in Accounts Payable | ||||||||||
| Capital Expenditure | ||||||||||
| UFCF | 5.7 | 12.8 | -21.0 | 60.9 | 63.6 | 22.1 | 54.1 | 66.8 | 82.6 | 102.1 |
| WACC, % | 5.36 | 5.25 | 5.27 | 5.23 | 5.36 | 5.3 | 5.3 | 5.3 | 5.3 | 5.3 |
| PV UFCF | ||||||||||
| SUM PV UFCF | 272.9 | |||||||||
| Long Term Growth Rate, % | 3.00 | |||||||||
| Free cash flow (T + 1) | 105 | |||||||||
| Terminal Value | 4,577 | |||||||||
| Present Terminal Value | 3,536 | |||||||||
| Enterprise Value | 3,809 | |||||||||
| Net Debt | -16 | |||||||||
| Equity Value | 3,825 | |||||||||
| Diluted Shares Outstanding, MM | 22 | |||||||||
| Equity Value Per Share | 176.97 |
Benefits of Choosing ZEAL Network SE (0QJQL)
- Flexible Forecast Inputs: Seamlessly adjust key assumptions (growth rates, profit margins, WACC) to explore various scenarios.
- Comprehensive Historical Data: Pre-filled financial metrics for ZEAL Network SE to accelerate your analytical process.
- Instant DCF Calculations: The template automatically computes Net Present Value (NPV) and intrinsic value based on your inputs.
- Professional and Tailorable: A refined Excel model designed to meet your specific valuation requirements.
- Designed for Investors and Analysts: Perfect for evaluating forecasts, validating business strategies, and optimizing efficiency.
Key Features
- Real-Time ZEAL Data: Pre-filled with ZEAL Network SE's historical performance metrics and future projections.
- Comprehensive Customization: Tailor revenue growth rates, margins, WACC, tax rates, and capital expenditures to fit your analysis.
- Interactive Valuation Framework: Instant updates to Net Present Value (NPV) and intrinsic value based on your specified parameters.
- Scenario Analysis: Develop various forecast scenarios to evaluate different valuation possibilities.
- Intuitive Interface: Designed for ease of use, making it accessible for both professionals and novices.
How It Works
- Step 1: Download the Excel file.
- Step 2: Examine ZEAL Network SE's pre-filled financial data and forecasts.
- Step 3: Adjust key inputs such as revenue growth, WACC, and tax rates (highlighted cells).
- Step 4: Observe the DCF model refresh in real-time as you modify your assumptions.
- Step 5: Evaluate the outputs and utilize the findings for informed investment decisions.
Why Choose This Calculator for ZEAL Network SE (0QJQL)?
- Precise Financial Insights: Utilize actual ZEAL Network SE data for trustworthy valuation outcomes.
- Flexible Settings: Tailor essential variables like growth rates, WACC, and tax rates to align with your forecasts.
- Effortless Efficiency: Built-in calculations save you from having to create formulas from the ground up.
- Professional-Quality Tool: Crafted for investors, analysts, and consultants seeking reliable analytics.
- Easy to Navigate: A user-friendly design and clear, step-by-step guidance make it accessible for everyone.
Who Should Utilize ZEAL Network SE (0QJQL)?
- Investors: Evaluate ZEAL Network SE's valuation prior to making stock trades.
- CFOs and Financial Analysts: Enhance valuation procedures and validate financial forecasts.
- Startup Founders: Understand how established companies like ZEAL Network SE are appraised.
- Consultants: Provide clients with detailed professional valuation reports.
- Students and Educators: Utilize real-world data to practice and instruct on valuation methodologies.
Contents of the Template
- Pre-Filled Data: Contains ZEAL Network SE’s historical financials and projections.
- Discounted Cash Flow Model: Customizable DCF valuation model with automatic calculations.
- Weighted Average Cost of Capital (WACC): A dedicated sheet for WACC calculation based on user-defined inputs.
- Key Financial Ratios: Evaluate ZEAL Network SE’s profitability, efficiency, and leverage.
- Customizable Inputs: Easily modify revenue growth, margins, and tax rates.
- Clear Dashboard: Visual representations and tables summarizing essential valuation outcomes.
Disclaimer
All information, articles, and product details provided on this website are for general informational and educational purposes only. We do not claim any ownership over, nor do we intend to infringe upon, any trademarks, copyrights, logos, brand names, or other intellectual property mentioned or depicted on this site. Such intellectual property remains the property of its respective owners, and any references here are made solely for identification or informational purposes, without implying any affiliation, endorsement, or partnership.
We make no representations or warranties, express or implied, regarding the accuracy, completeness, or suitability of any content or products presented. Nothing on this website should be construed as legal, tax, investment, financial, medical, or other professional advice. In addition, no part of this site—including articles or product references—constitutes a solicitation, recommendation, endorsement, advertisement, or offer to buy or sell any securities, franchises, or other financial instruments, particularly in jurisdictions where such activity would be unlawful.
All content is of a general nature and may not address the specific circumstances of any individual or entity. It is not a substitute for professional advice or services. Any actions you take based on the information provided here are strictly at your own risk. You accept full responsibility for any decisions or outcomes arising from your use of this website and agree to release us from any liability in connection with your use of, or reliance upon, the content or products found herein.