
|
Graubündner Kantonalbank (0QLT.L) DCF Avaliação |
Totalmente Editável: Adapte-Se Às Suas Necessidades No Excel Ou Planilhas
Design Profissional: Modelos Confiáveis E Padrão Da Indústria
Pré-Construídos Para Uso Rápido E Eficiente
Compatível com MAC/PC, totalmente desbloqueado
Não É Necessária Experiência; Fácil De Seguir
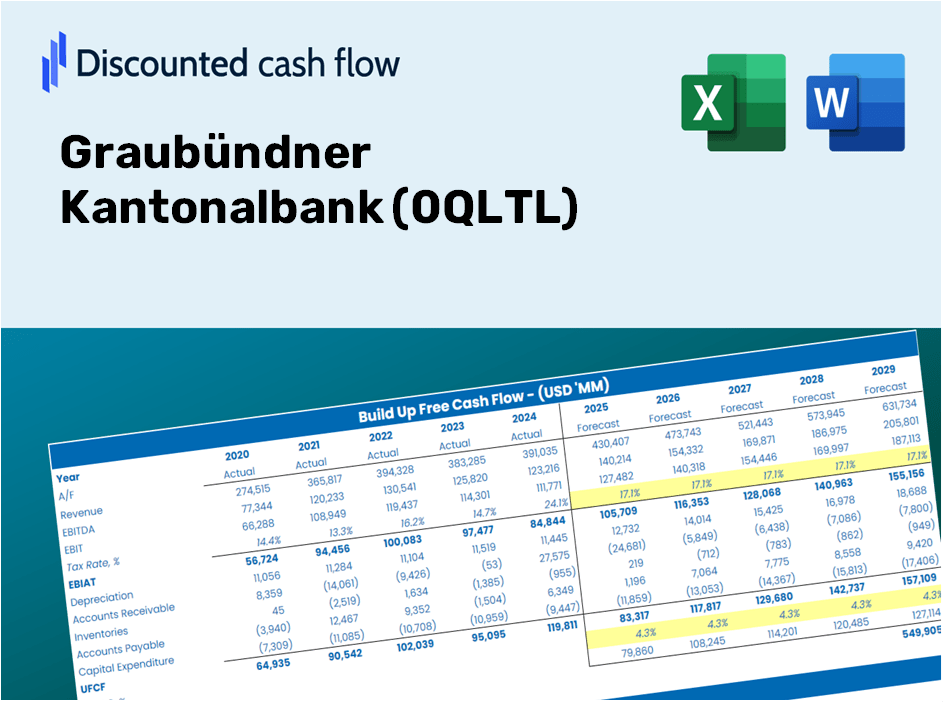
Graubündner Kantonalbank (0QLT.L) Bundle
Procurando avaliar o valor intrínseco de Graubündner Kantonalbank? Nossa calculadora DCF (0QLTL) integra dados do mundo real com recursos abrangentes de personalização, permitindo ajustar as previsões e aprimorar suas estratégias de investimento.
Benefits You Will Receive
- Pre-Populated Financial Model: Graubündner Kantonalbank’s actual figures provide accurate DCF valuation.
- Complete Forecasting Control: Modify revenue growth, margins, WACC, and other vital parameters.
- Real-Time Calculations: Automatic updates allow you to see results immediately as adjustments are made.
- Professional-Grade Template: A polished Excel file crafted for high-quality valuation presentations.
- Adaptable and Reusable: Designed for versatility, enabling repeated use for thorough forecasting.
Key Features
- Comprehensive DCF Calculator: Offers detailed unlevered and levered DCF valuation models tailored for Graubündner Kantonalbank (0QLTL).
- WACC Calculator: Features a pre-configured Weighted Average Cost of Capital sheet with adjustable inputs for precision.
- Customizable Forecast Assumptions: Easily adjust growth rates, capital expenditures, and discount rates to fit your analysis.
- Integrated Financial Ratios: Evaluate profitability, leverage, and efficiency ratios specifically for Graubündner Kantonalbank (0QLTL).
- Visual Dashboard and Charts: Graphical representations of key valuation metrics provide straightforward insights for analysis.
How It Works
- Step 1: Download the prebuilt Excel template featuring Graubündner Kantonalbank's (0QLTL) data.
- Step 2: Navigate through the pre-filled sheets to familiarize yourself with the essential metrics.
- Step 3: Modify forecasts and assumptions in the editable yellow cells (WACC, growth, margins).
- Step 4: Immediately see the recalculated results, including Graubündner Kantonalbank's (0QLTL) intrinsic value.
- Step 5: Use the outputs to make informed investment decisions or create detailed reports.
Why Choose the Graubündner Kantonalbank Calculator?
- All-in-One Solution: Combines DCF, WACC, and comprehensive financial ratio analysis in a single platform.
- Flexible Inputs: Modify the highlighted cells to explore different financial scenarios.
- In-Depth Analysis: Automatically computes the intrinsic value and Net Present Value for Graubündner Kantonalbank (0QLTL).
- Preloaded Information: Access historical and forecast data for reliable analysis.
- Expert-Level Design: Perfect for financial analysts, investors, and business advisors.
Who Can Benefit from Graubündner Kantonalbank (0QLTL)?
- Finance Students: Master financial analysis techniques using real-life data.
- Academics: Integrate leading financial models into your teaching or research projects.
- Investors: Evaluate your assumptions and assess financial outcomes for Graubündner Kantonalbank (0QLTL).
- Analysts: Improve efficiency with a ready-made, adaptable DCF model.
- Small Business Owners: Understand how major financial institutions like Graubündner Kantonalbank (0QLTL) are evaluated.
Contents of the Template
- Operating and Balance Sheet Data: Pre-filled historical data and forecasts for Graubündner Kantonalbank (0QLTL), encompassing revenue, EBITDA, EBIT, and capital expenditures.
- WACC Calculation: A dedicated worksheet for computing the Weighted Average Cost of Capital (WACC), featuring parameters such as Beta, risk-free rate, and share price.
- DCF Valuation (Unlevered and Levered): Customizable Discounted Cash Flow models that provide intrinsic value calculations with comprehensive details.
- Financial Statements: Pre-loaded annual and quarterly financial statements to aid in thorough analysis.
- Key Ratios: Includes profitability, leverage, and efficiency ratios specific to Graubündner Kantonalbank (0QLTL).
- Dashboard and Charts: A visual summary of valuation outputs and assumptions to simplify the analysis of results.
Disclaimer
All information, articles, and product details provided on this website are for general informational and educational purposes only. We do not claim any ownership over, nor do we intend to infringe upon, any trademarks, copyrights, logos, brand names, or other intellectual property mentioned or depicted on this site. Such intellectual property remains the property of its respective owners, and any references here are made solely for identification or informational purposes, without implying any affiliation, endorsement, or partnership.
We make no representations or warranties, express or implied, regarding the accuracy, completeness, or suitability of any content or products presented. Nothing on this website should be construed as legal, tax, investment, financial, medical, or other professional advice. In addition, no part of this site—including articles or product references—constitutes a solicitation, recommendation, endorsement, advertisement, or offer to buy or sell any securities, franchises, or other financial instruments, particularly in jurisdictions where such activity would be unlawful.
All content is of a general nature and may not address the specific circumstances of any individual or entity. It is not a substitute for professional advice or services. Any actions you take based on the information provided here are strictly at your own risk. You accept full responsibility for any decisions or outcomes arising from your use of this website and agree to release us from any liability in connection with your use of, or reliance upon, the content or products found herein.