
|
Roche Holding AG (0QQ6.L) Avaliação DCF |
Totalmente Editável: Adapte-Se Às Suas Necessidades No Excel Ou Planilhas
Design Profissional: Modelos Confiáveis E Padrão Da Indústria
Pré-Construídos Para Uso Rápido E Eficiente
Compatível com MAC/PC, totalmente desbloqueado
Não É Necessária Experiência; Fácil De Seguir
Roche Holding AG (0QQ6.L) Bundle
Explore a perspectiva financeira do Roche Holding AG (0QQ6L) com nossa calculadora DCF amigável! Digite suas projeções de crescimento, margens e despesas para calcular o valor intrínseco da Roche Holding AG (0QQ6L) e refine sua abordagem de investimento.
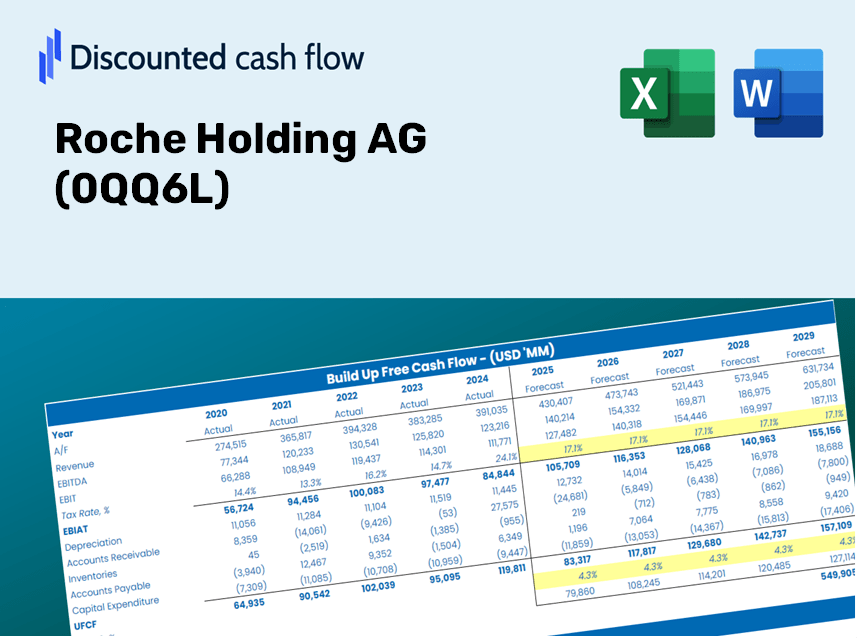
Discounted Cash Flow (DCF) - (USD MM)
| Year | AY1 2020 |
AY2 2021 |
AY3 2022 |
AY4 2023 |
AY5 2024 |
FY1 2025 |
FY2 2026 |
FY3 2027 |
FY4 2028 |
FY5 2029 |
|---|---|---|---|---|---|---|---|---|---|---|
| Revenue | 58,323.0 | 62,801.0 | 63,281.0 | 60,441.0 | 62,395.0 | 63,516.1 | 64,657.4 | 65,819.2 | 67,001.8 | 68,205.7 |
| Revenue Growth, % | 0 | 7.68 | 0.76432 | -4.49 | 3.23 | 1.8 | 1.8 | 1.8 | 1.8 | 1.8 |
| EBITDA | 22,969.0 | 22,188.0 | 20,800.0 | 18,413.0 | 16,619.0 | 20,919.9 | 21,295.8 | 21,678.4 | 22,068.0 | 22,464.5 |
| EBITDA, % | 39.38 | 35.33 | 32.87 | 30.46 | 26.64 | 32.94 | 32.94 | 32.94 | 32.94 | 32.94 |
| Depreciation | 4,565.0 | 4,447.0 | 3,824.0 | 3,464.0 | 3,423.0 | 4,086.4 | 4,159.8 | 4,234.6 | 4,310.7 | 4,388.1 |
| Depreciation, % | 7.83 | 7.08 | 6.04 | 5.73 | 5.49 | 6.43 | 6.43 | 6.43 | 6.43 | 6.43 |
| EBIT | 18,404.0 | 17,741.0 | 16,976.0 | 14,949.0 | 13,196.0 | 16,833.5 | 17,136.0 | 17,443.9 | 17,757.3 | 18,076.4 |
| EBIT, % | 31.56 | 28.25 | 26.83 | 24.73 | 21.15 | 26.5 | 26.5 | 26.5 | 26.5 | 26.5 |
| Total Cash | 12,334.0 | 13,031.0 | 9,767.0 | 10,510.0 | 17,317.0 | 13,017.6 | 13,251.5 | 13,489.6 | 13,731.9 | 13,978.7 |
| Total Cash, percent | .0 | .0 | .0 | .0 | .0 | .0 | .0 | .0 | .0 | .0 |
| Account Receivables | 11,740.0 | 12,651.0 | 13,866.0 | 12,980.0 | 13,485.0 | 13,373.1 | 13,613.4 | 13,858.0 | 14,107.0 | 14,360.5 |
| Account Receivables, % | 20.13 | 20.14 | 21.91 | 21.48 | 21.61 | 21.05 | 21.05 | 21.05 | 21.05 | 21.05 |
| Inventories | 7,194.0 | 7,715.0 | 8,605.0 | 7,749.0 | 7,606.0 | 8,032.1 | 8,176.4 | 8,323.3 | 8,472.8 | 8,625.1 |
| Inventories, % | 12.33 | 12.28 | 13.6 | 12.82 | 12.19 | 12.65 | 12.65 | 12.65 | 12.65 | 12.65 |
| Accounts Payable | 3,317.0 | 3,844.0 | 3,861.0 | 3,524.0 | 3,984.0 | 3,826.9 | 3,895.6 | 3,965.6 | 4,036.9 | 4,109.4 |
| Accounts Payable, % | 5.69 | 6.12 | 6.1 | 5.83 | 6.39 | 6.03 | 6.03 | 6.03 | 6.03 | 6.03 |
| Capital Expenditure | -6,690.0 | -4,549.0 | -4,552.0 | -4,649.0 | -5,009.0 | -5,288.0 | -5,383.0 | -5,479.7 | -5,578.2 | -5,678.4 |
| Capital Expenditure, % | -11.47 | -7.24 | -7.19 | -7.69 | -8.03 | -8.33 | -8.33 | -8.33 | -8.33 | -8.33 |
| Tax Rate, % | 29.81 | 29.81 | 29.81 | 29.81 | 29.81 | 29.81 | 29.81 | 29.81 | 29.81 | 29.81 |
| EBITAT | 14,643.5 | 14,203.0 | 12,882.4 | 12,208.5 | 9,261.7 | 13,041.4 | 13,275.7 | 13,514.2 | 13,757.1 | 14,004.3 |
| Depreciation | ||||||||||
| Changes in Account Receivables | ||||||||||
| Changes in Inventories | ||||||||||
| Changes in Accounts Payable | ||||||||||
| Capital Expenditure | ||||||||||
| UFCF | -3,098.5 | 13,196.0 | 10,066.4 | 12,428.5 | 7,773.7 | 11,368.5 | 11,736.7 | 11,947.6 | 12,162.2 | 12,380.8 |
| WACC, % | 4.45 | 4.45 | 4.43 | 4.46 | 4.4 | 4.44 | 4.44 | 4.44 | 4.44 | 4.44 |
| PV UFCF | ||||||||||
| SUM PV UFCF | 52,320.6 | |||||||||
| Long Term Growth Rate, % | 2.00 | |||||||||
| Free cash flow (T + 1) | 12,628 | |||||||||
| Terminal Value | 517,834 | |||||||||
| Present Terminal Value | 416,757 | |||||||||
| Enterprise Value | 469,078 | |||||||||
| Net Debt | 29,379 | |||||||||
| Equity Value | 439,699 | |||||||||
| Diluted Shares Outstanding, MM | 802 | |||||||||
| Equity Value Per Share | 548.25 |
What You Will Receive
- Pre-Filled Financial Model: Utilize Roche Holding AG's actual data for accurate DCF valuation.
- Full Forecast Control: Modify revenue growth, profit margins, WACC, and other crucial metrics.
- Instant Calculations: Real-time updates allow you to see results immediately as you make adjustments.
- Investor-Ready Template: A polished Excel file crafted for high-quality valuation purposes.
- Customizable and Reusable: Designed for adaptability, enabling repeated use for in-depth forecasts.
Key Features
- Pre-Loaded Data: Roche Holding AG's historical financial statements and pre-filled forecasts.
- Fully Adjustable Inputs: Customize WACC, tax rates, revenue growth, and EBITDA margins to fit your analysis.
- Instant Results: Monitor Roche Holding AG's intrinsic value recalculating in real time.
- Clear Visual Outputs: Comprehensive dashboard charts illustrate valuation results and key metrics.
- Built for Accuracy: A professional-grade tool designed for analysts, investors, and finance professionals.
How It Works
- 1. Access the Template: Download and open the Excel file featuring Roche Holding AG’s (0QQ6L) preconfigured data.
- 2. Adjust Assumptions: Modify essential parameters such as growth projections, WACC, and capital expenditures.
- 3. View Immediate Results: The DCF model automatically computes the intrinsic value and NPV.
- 4. Explore Scenarios: Evaluate different forecasts to assess various valuation results.
- 5. Present with Confidence: Provide professional valuation insights to back your decision-making process.
Why Opt for This Calculator?
- Designed for Experts: A sophisticated tool favored by analysts, CFOs, and consultants.
- Accurate Financials: Roche Holding AG’s historical and projected financial data preloaded for precision.
- Flexible Scenario Analysis: Effortlessly simulate various forecasts and assumptions.
- Comprehensive Outputs: Automatically computes intrinsic value, NPV, and essential metrics.
- User-Friendly: Step-by-step guidance ensures a smooth experience throughout the process.
Who Can Benefit from This Product?
- Investors: Accurately assess Roche Holding AG’s fair value prior to making investment choices.
- CFOs: Utilize a high-quality DCF model for enhanced financial reporting and analysis.
- Consultants: Effortlessly modify the template for client valuation reports.
- Entrepreneurs: Acquire insights into financial modeling techniques employed by leading corporations.
- Educators: Implement it as a resource to illustrate valuation methodologies in the classroom.
Contents of the Template
- Pre-Filled Data: Contains Roche Holding AG's historical financials and projections.
- Discounted Cash Flow Model: An editable DCF valuation model with automatic calculations included.
- Weighted Average Cost of Capital (WACC): A separate sheet for calculating WACC using customized inputs.
- Key Financial Ratios: Evaluate Roche Holding AG's profitability, efficiency, and leverage.
- Customizable Inputs: Easily modify revenue growth, margins, and tax rates.
- Clear Dashboard: Visual summaries of key valuation results through charts and tables.
Disclaimer
All information, articles, and product details provided on this website are for general informational and educational purposes only. We do not claim any ownership over, nor do we intend to infringe upon, any trademarks, copyrights, logos, brand names, or other intellectual property mentioned or depicted on this site. Such intellectual property remains the property of its respective owners, and any references here are made solely for identification or informational purposes, without implying any affiliation, endorsement, or partnership.
We make no representations or warranties, express or implied, regarding the accuracy, completeness, or suitability of any content or products presented. Nothing on this website should be construed as legal, tax, investment, financial, medical, or other professional advice. In addition, no part of this site—including articles or product references—constitutes a solicitation, recommendation, endorsement, advertisement, or offer to buy or sell any securities, franchises, or other financial instruments, particularly in jurisdictions where such activity would be unlawful.
All content is of a general nature and may not address the specific circumstances of any individual or entity. It is not a substitute for professional advice or services. Any actions you take based on the information provided here are strictly at your own risk. You accept full responsibility for any decisions or outcomes arising from your use of this website and agree to release us from any liability in connection with your use of, or reliance upon, the content or products found herein.