
|
Bufab AB (0QRA.L) Avaliação DCF |
Totalmente Editável: Adapte-Se Às Suas Necessidades No Excel Ou Planilhas
Design Profissional: Modelos Confiáveis E Padrão Da Indústria
Pré-Construídos Para Uso Rápido E Eficiente
Compatível com MAC/PC, totalmente desbloqueado
Não É Necessária Experiência; Fácil De Seguir
Bufab AB (publ) (0QRA.L) Bundle
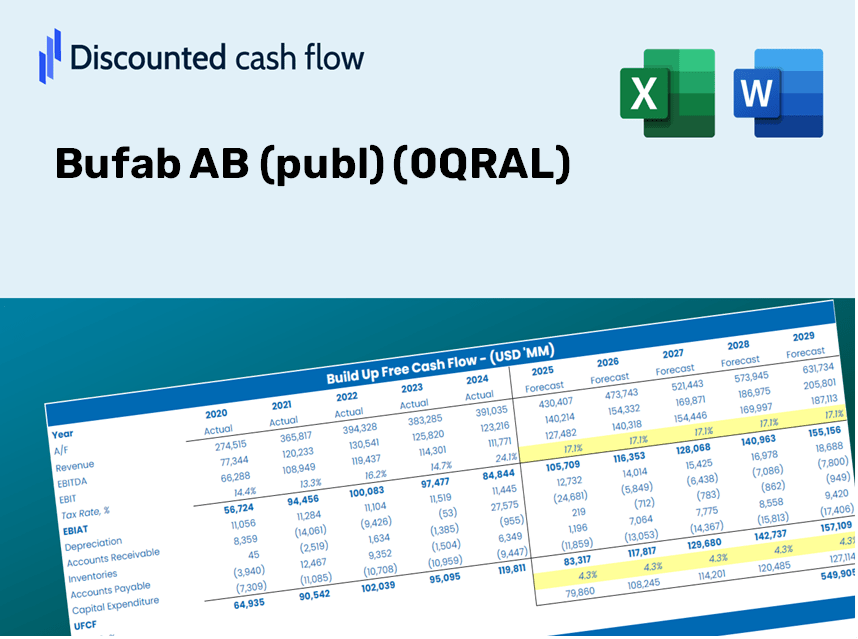
Explore o potencial financeiro do bufab ab (publ) (0qral) com a nossa calculadora DCF fácil de usar! Digite suas projeções de crescimento, margens e despesas para calcular o valor intrínseco do bufab ab (publ) (0qral) e aprimorar sua tomada de decisão de investimento.
Discounted Cash Flow (DCF) - (USD MM)
| Year | AY1 2020 |
AY2 2021 |
AY3 2022 |
AY4 2023 |
AY5 2024 |
FY1 2025 |
FY2 2026 |
FY3 2027 |
FY4 2028 |
FY5 2029 |
|---|---|---|---|---|---|---|---|---|---|---|
| Revenue | 4,756.0 | 5,878.0 | 8,431.0 | 8,680.0 | 8,035.0 | 9,291.4 | 10,744.3 | 12,424.3 | 14,367.1 | 16,613.6 |
| Revenue Growth, % | 0 | 23.59 | 43.43 | 2.95 | -7.43 | 15.64 | 15.64 | 15.64 | 15.64 | 15.64 |
| EBITDA | 634.0 | 848.0 | 1,185.0 | 1,188.0 | 1,183.0 | 1,304.9 | 1,509.0 | 1,744.9 | 2,017.8 | 2,333.3 |
| EBITDA, % | 13.33 | 14.43 | 14.06 | 13.69 | 14.72 | 14.04 | 14.04 | 14.04 | 14.04 | 14.04 |
| Depreciation | 183.0 | 192.0 | 240.0 | 140.0 | 279.0 | 279.6 | 323.3 | 373.9 | 432.3 | 499.9 |
| Depreciation, % | 3.85 | 3.27 | 2.85 | 1.61 | 3.47 | 3.01 | 3.01 | 3.01 | 3.01 | 3.01 |
| EBIT | 451.0 | 656.0 | 945.0 | 1,048.0 | 904.0 | 1,025.3 | 1,185.7 | 1,371.1 | 1,585.4 | 1,833.4 |
| EBIT, % | 9.48 | 11.16 | 11.21 | 12.07 | 11.25 | 11.04 | 11.04 | 11.04 | 11.04 | 11.04 |
| Total Cash | 292.0 | 293.0 | 322.0 | 218.0 | 211.0 | 373.2 | 431.5 | 499.0 | 577.0 | 667.2 |
| Total Cash, percent | .0 | .0 | .0 | .0 | .0 | .0 | .0 | .0 | .0 | .0 |
| Account Receivables | 772.0 | 1,162.0 | 1,483.0 | 1,252.0 | 1,547.0 | 1,621.7 | 1,875.3 | 2,168.5 | 2,507.6 | 2,899.7 |
| Account Receivables, % | 16.23 | 19.77 | 17.59 | 14.42 | 19.25 | 17.45 | 17.45 | 17.45 | 17.45 | 17.45 |
| Inventories | 1,316.0 | 2,140.0 | 3,449.0 | 2,857.0 | 2,803.0 | 3,210.8 | 3,712.9 | 4,293.5 | 4,964.9 | 5,741.2 |
| Inventories, % | 27.67 | 36.41 | 40.91 | 32.91 | 34.88 | 34.56 | 34.56 | 34.56 | 34.56 | 34.56 |
| Accounts Payable | 454.0 | 815.0 | 769.0 | 621.0 | 729.0 | 906.1 | 1,047.8 | 1,211.6 | 1,401.1 | 1,620.1 |
| Accounts Payable, % | 9.55 | 13.87 | 9.12 | 7.15 | 9.07 | 9.75 | 9.75 | 9.75 | 9.75 | 9.75 |
| Capital Expenditure | -66.0 | -34.0 | -66.0 | -78.0 | -64.0 | -82.6 | -95.5 | -110.4 | -127.7 | -147.7 |
| Capital Expenditure, % | -1.39 | -0.57843 | -0.78283 | -0.89862 | -0.79652 | -0.88882 | -0.88882 | -0.88882 | -0.88882 | -0.88882 |
| Tax Rate, % | 20.72 | 20.72 | 20.72 | 20.72 | 20.72 | 20.72 | 20.72 | 20.72 | 20.72 | 20.72 |
| EBITAT | 344.0 | 501.3 | 695.1 | 796.8 | 716.7 | 782.4 | 904.8 | 1,046.3 | 1,209.9 | 1,399.1 |
| Depreciation | ||||||||||
| Changes in Account Receivables | ||||||||||
| Changes in Inventories | ||||||||||
| Changes in Accounts Payable | ||||||||||
| Capital Expenditure | ||||||||||
| UFCF | -1,173.0 | -193.7 | -806.9 | 1,533.8 | 798.7 | 674.0 | 518.6 | 599.7 | 693.5 | 802.0 |
| WACC, % | 9.43 | 9.43 | 9.4 | 9.42 | 9.46 | 9.43 | 9.43 | 9.43 | 9.43 | 9.43 |
| PV UFCF | ||||||||||
| SUM PV UFCF | 2,501.6 | |||||||||
| Long Term Growth Rate, % | 2.00 | |||||||||
| Free cash flow (T + 1) | 818 | |||||||||
| Terminal Value | 11,013 | |||||||||
| Present Terminal Value | 7,019 | |||||||||
| Enterprise Value | 9,521 | |||||||||
| Net Debt | 3,315 | |||||||||
| Equity Value | 6,206 | |||||||||
| Diluted Shares Outstanding, MM | 190 | |||||||||
| Equity Value Per Share | 32.61 |
What You Will Receive
- Editable Excel Template: A fully customizable Excel-based DCF Calculator featuring pre-filled financials for Bufab AB (publ) (0QRAL).
- Real-World Data: Access to historical performance and forward-looking estimates (highlighted in the yellow cells).
- Forecast Flexibility: Adjust key assumptions such as revenue growth, EBITDA percentage, and WACC.
- Automatic Calculations: Immediately observe how your changes affect Bufab AB's (publ) (0QRAL) valuation.
- Professional Tool: Designed specifically for investors, CFOs, consultants, and financial analysts.
- User-Friendly Design: Organized for clarity and simplicity, complete with step-by-step guidance.
Highlighted Features
- Authentic Bufab AB Data: Pre-loaded with Bufab AB's historical financial data and future projections.
- Customizable Parameters: Modify revenue growth, profit margins, WACC, tax rates, and capital expenditures as needed.
- Interactive Valuation Model: Real-time updates of Net Present Value (NPV) and intrinsic value based on your adjustments.
- Scenario Analysis: Develop various forecasting scenarios to evaluate different valuation possibilities.
- Intuitive Interface: Clean, organized, and suitable for both professionals and newcomers.
How It Works
- 1. Access the Template: Download and open the Excel file containing Bufab AB (publ) (0QRAL) preloaded data.
- 2. Adjust Assumptions: Modify key parameters such as growth rates, WACC, and capital expenditures.
- 3. See Results Instantly: The DCF model automatically computes intrinsic value and NPV.
- 4. Evaluate Scenarios: Analyze various forecasts to compare different valuation results.
- 5. Present with Assurance: Deliver professional valuation insights to bolster your decision-making.
Why Choose This Calculator for Bufab AB (0QRAL)?
- All-in-One Solution: Features DCF, WACC, and financial ratio analyses consolidated in a single tool.
- Flexible Inputs: Modify the yellow-highlighted cells to explore different scenarios.
- In-Depth Analysis: Automatically computes Bufab AB's intrinsic value and Net Present Value.
- Ready-to-Use Data: Historical and projected data provide reliable starting points for your calculations.
- High-Quality Standards: Perfect for financial analysts, investors, and business consultants focused on Bufab AB (0QRAL).
Who Can Benefit from Bufab AB (0QRAL)?
- Professional Investors: Develop comprehensive and trustworthy valuation models for investment analysis.
- Corporate Finance Departments: Evaluate valuation scenarios to inform strategic decisions.
- Consultants and Advisors: Deliver precise valuation insights for Bufab AB (0QRAL) to clients.
- Students and Educators: Leverage real-world data to enhance financial modeling skills and education.
- Industry Enthusiasts: Gain insights into how companies like Bufab AB (0QRAL) are assessed in the marketplace.
Contents of the Template
- Thorough DCF Model: An editable template featuring in-depth valuation calculations.
- Actual Data: Bufab AB’s (0QRAL) historical and projected financial figures preloaded for your analysis.
- Adjustable Parameters: Modify WACC, growth rates, and tax assumptions to explore various scenarios.
- Financial Statements: Comprehensive annual and quarterly breakdowns for enhanced insights.
- Key Ratios: Integrated analysis covering profitability, efficiency, and leverage metrics.
- Dashboard with Visual Outputs: Graphs and tables that present clear, actionable results.
Disclaimer
All information, articles, and product details provided on this website are for general informational and educational purposes only. We do not claim any ownership over, nor do we intend to infringe upon, any trademarks, copyrights, logos, brand names, or other intellectual property mentioned or depicted on this site. Such intellectual property remains the property of its respective owners, and any references here are made solely for identification or informational purposes, without implying any affiliation, endorsement, or partnership.
We make no representations or warranties, express or implied, regarding the accuracy, completeness, or suitability of any content or products presented. Nothing on this website should be construed as legal, tax, investment, financial, medical, or other professional advice. In addition, no part of this site—including articles or product references—constitutes a solicitation, recommendation, endorsement, advertisement, or offer to buy or sell any securities, franchises, or other financial instruments, particularly in jurisdictions where such activity would be unlawful.
All content is of a general nature and may not address the specific circumstances of any individual or entity. It is not a substitute for professional advice or services. Any actions you take based on the information provided here are strictly at your own risk. You accept full responsibility for any decisions or outcomes arising from your use of this website and agree to release us from any liability in connection with your use of, or reliance upon, the content or products found herein.