
|
Camurus AB (0RD1.L) Avaliação DCF |
Totalmente Editável: Adapte-Se Às Suas Necessidades No Excel Ou Planilhas
Design Profissional: Modelos Confiáveis E Padrão Da Indústria
Pré-Construídos Para Uso Rápido E Eficiente
Compatível com MAC/PC, totalmente desbloqueado
Não É Necessária Experiência; Fácil De Seguir
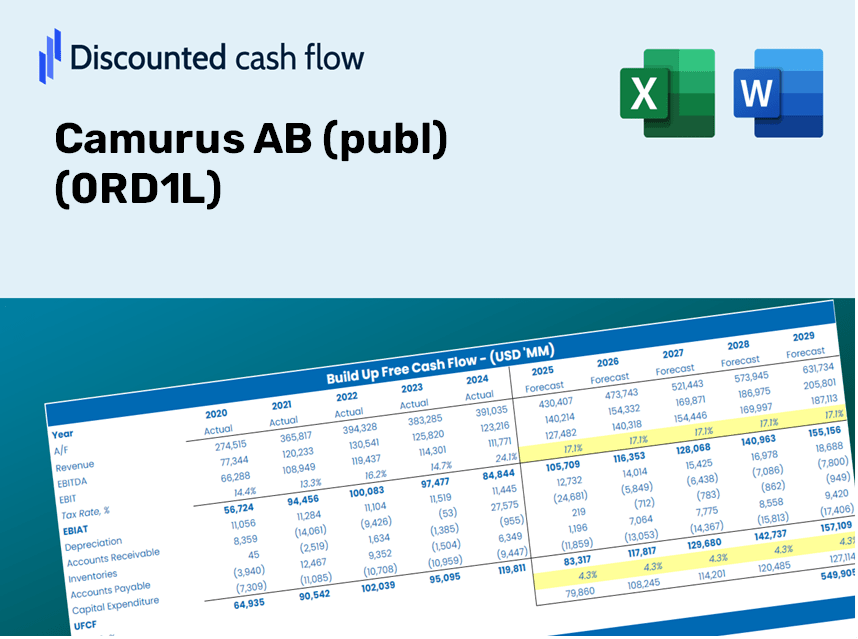
Camurus AB (publ) (0RD1.L) Bundle
Aprimore suas estratégias de investimento com a calculadora DCF Camurus AB (publ)! Utilize dados financeiros precisos, ajuste as previsões e despesas do crescimento e observe instantaneamente como essas alterações afetam o valor intrínseco de Camurus AB (publ).
Discounted Cash Flow (DCF) - (USD MM)
| Year | AY1 2020 |
AY2 2021 |
AY3 2022 |
AY4 2023 |
AY5 2024 |
FY1 2025 |
FY2 2026 |
FY3 2027 |
FY4 2028 |
FY5 2029 |
|---|---|---|---|---|---|---|---|---|---|---|
| Revenue | 336.0 | 600.6 | 956.3 | 1,716.9 | 1,867.6 | 2,924.1 | 4,578.3 | 7,168.3 | 11,223.4 | 17,572.6 |
| Revenue Growth, % | 0 | 78.74 | 59.24 | 79.52 | 8.78 | 56.57 | 56.57 | 56.57 | 56.57 | 56.57 |
| EBITDA | -196.6 | -97.7 | 87.6 | 562.5 | 568.2 | -14.2 | -22.2 | -34.8 | -54.5 | -85.3 |
| EBITDA, % | -58.51 | -16.27 | 9.16 | 32.77 | 30.43 | -0.48551 | -0.48551 | -0.48551 | -0.48551 | -0.48551 |
| Depreciation | 8.5 | 12.7 | 12.9 | 11.9 | 14.6 | 43.6 | 68.3 | 106.9 | 167.4 | 262.1 |
| Depreciation, % | 2.52 | 2.11 | 1.35 | 0.69325 | 0.78374 | 1.49 | 1.49 | 1.49 | 1.49 | 1.49 |
| EBIT | -205.0 | -110.4 | 74.7 | 550.6 | 553.6 | -57.8 | -90.5 | -141.7 | -221.9 | -347.4 |
| EBIT, % | -61.02 | -18.38 | 7.81 | 32.07 | 29.64 | -1.98 | -1.98 | -1.98 | -1.98 | -1.98 |
| Total Cash | 461.8 | 411.6 | 565.5 | 1,189.8 | 2,852.7 | 2,321.6 | 3,634.9 | 5,691.2 | 8,910.7 | 13,951.6 |
| Total Cash, percent | .0 | .0 | .0 | .0 | .0 | .0 | .0 | .0 | .0 | .0 |
| Account Receivables | 89.6 | 154.6 | 225.4 | 315.1 | 523.6 | 715.6 | 1,120.4 | 1,754.3 | 2,746.7 | 4,300.5 |
| Account Receivables, % | 26.67 | 25.74 | 23.57 | 18.36 | 28.04 | 24.47 | 24.47 | 24.47 | 24.47 | 24.47 |
| Inventories | 111.3 | 107.2 | 107.4 | 101.0 | 140.2 | 442.2 | 692.3 | 1,084.0 | 1,697.2 | 2,657.4 |
| Inventories, % | 33.14 | 17.85 | 11.23 | 5.88 | 7.51 | 15.12 | 15.12 | 15.12 | 15.12 | 15.12 |
| Accounts Payable | 20.7 | 52.9 | 85.5 | 99.3 | 118.3 | 210.7 | 329.9 | 516.5 | 808.7 | 1,266.1 |
| Accounts Payable, % | 6.16 | 8.8 | 8.95 | 5.78 | 6.33 | 7.21 | 7.21 | 7.21 | 7.21 | 7.21 |
| Capital Expenditure | -3.3 | -4.9 | -1.9 | -10.1 | -29.4 | -24.4 | -38.2 | -59.9 | -93.7 | -146.7 |
| Capital Expenditure, % | -0.98989 | -0.82305 | -0.1992 | -0.58986 | -1.57 | -0.83493 | -0.83493 | -0.83493 | -0.83493 | -0.83493 |
| Tax Rate, % | 22.47 | 22.47 | 22.47 | 22.47 | 22.47 | 22.47 | 22.47 | 22.47 | 22.47 | 22.47 |
| EBITAT | -166.0 | -89.3 | 56.7 | 432.5 | 429.2 | -45.5 | -71.3 | -111.7 | -174.8 | -273.7 |
| Depreciation | ||||||||||
| Changes in Account Receivables | ||||||||||
| Changes in Inventories | ||||||||||
| Changes in Accounts Payable | ||||||||||
| Capital Expenditure | ||||||||||
| UFCF | -341.1 | -110.3 | 29.4 | 364.7 | 185.7 | -427.9 | -577.0 | -903.5 | -1,414.6 | -2,214.8 |
| WACC, % | 5.99 | 5.99 | 5.99 | 5.99 | 5.99 | 5.99 | 5.99 | 5.99 | 5.99 | 5.99 |
| PV UFCF | ||||||||||
| SUM PV UFCF | -4,452.9 | |||||||||
| Long Term Growth Rate, % | 2.00 | |||||||||
| Free cash flow (T + 1) | -2,259 | |||||||||
| Terminal Value | -56,621 | |||||||||
| Present Terminal Value | -42,331 | |||||||||
| Enterprise Value | -46,784 | |||||||||
| Net Debt | -2,836 | |||||||||
| Equity Value | -43,948 | |||||||||
| Diluted Shares Outstanding, MM | 60 | |||||||||
| Equity Value Per Share | -738.62 |
What You Will Receive
- Authentic CAMX Financials: Access both historical and projected data for precise valuation.
- Customizable Inputs: Adjust WACC, tax rates, revenue growth, and capital expenditure assumptions.
- Automated Calculations: Intrinsic value and NPV are computed in real-time.
- Scenario Analysis: Explore various scenarios to assess Camurus AB's (0RD1L) future performance.
- User-Friendly Design: Designed for industry professionals while remaining approachable for newcomers.
Key Features
- Accurate Financial Data for Camurus AB: Gain access to reliable historical data and forward-looking projections.
- Tailored Forecast Inputs: Customize key variables like WACC, growth rates, and profit margins in the highlighted cells.
- Real-Time Calculations: Automatic recalculations for DCF, Net Present Value (NPV), and cash flow metrics.
- User-Friendly Dashboard: Intuitive charts and summaries for easy visualization of your valuation outcomes.
- Designed for All Users: A straightforward framework suitable for investors, CFOs, and consultants alike.
How It Operates
- Download: Obtain the pre-formatted Excel file containing Camurus AB’s financial data.
- Customize: Tailor forecasts such as revenue growth, EBITDA percentage, and WACC to your preferences.
- Update Automatically: Enjoy real-time updates for intrinsic value and NPV calculations.
- Test Scenarios: Generate various projections and instantly compare the results.
- Make Decisions: Leverage the valuation findings to inform your investment approach.
Why Choose This Calculator for Camurus AB (publ) (0RD1L)?
- User-Friendly Interface: Ideal for both novices and seasoned professionals.
- Customizable Inputs: Modify parameters effortlessly to suit your analysis needs.
- Real-Time Valuation Updates: Observe immediate adjustments to Camurus AB’s valuation with input changes.
- Preloaded Data: Contains Camurus AB’s actual financial figures for swift assessment.
- Relied Upon by Experts: Utilized by investors and analysts for making well-informed decisions.
Who Can Benefit from Camurus AB (publ) (0RD1L)?
- Investors: Make informed investment decisions with a cutting-edge analysis tool tailored for the pharmaceutical sector.
- Financial Analysts: Streamline your workflow with a customizable financial model designed specifically for biotech companies.
- Consultants: Effortlessly modify the framework for client pitches or detailed reports on Camurus AB (publ) (0RD1L).
- Healthcare Enthusiasts: Expand your knowledge of market trends and valuation methodologies in the biopharmaceutical field.
- Educators and Students: Leverage this resource as a practical guide in finance and healthcare-related academic programs.
Contents of the Template
- Operating and Balance Sheet Data: Pre-filled historical data and forecasts for Camurus AB (publ) (0RD1L), including revenue, EBITDA, EBIT, and capital expenditures.
- WACC Calculation: A dedicated sheet for the Weighted Average Cost of Capital (WACC), featuring parameters such as Beta, risk-free rate, and share price.
- DCF Valuation (Unlevered and Levered): Customizable Discounted Cash Flow models demonstrating intrinsic value with comprehensive calculations.
- Financial Statements: Pre-loaded financial statements (annual and quarterly) to aid in analysis.
- Key Ratios: Includes profitability, leverage, and efficiency ratios specific to Camurus AB (publ) (0RD1L).
- Dashboard and Charts: Visual overview of valuation outputs and assumptions for easy results analysis.
Disclaimer
All information, articles, and product details provided on this website are for general informational and educational purposes only. We do not claim any ownership over, nor do we intend to infringe upon, any trademarks, copyrights, logos, brand names, or other intellectual property mentioned or depicted on this site. Such intellectual property remains the property of its respective owners, and any references here are made solely for identification or informational purposes, without implying any affiliation, endorsement, or partnership.
We make no representations or warranties, express or implied, regarding the accuracy, completeness, or suitability of any content or products presented. Nothing on this website should be construed as legal, tax, investment, financial, medical, or other professional advice. In addition, no part of this site—including articles or product references—constitutes a solicitation, recommendation, endorsement, advertisement, or offer to buy or sell any securities, franchises, or other financial instruments, particularly in jurisdictions where such activity would be unlawful.
All content is of a general nature and may not address the specific circumstances of any individual or entity. It is not a substitute for professional advice or services. Any actions you take based on the information provided here are strictly at your own risk. You accept full responsibility for any decisions or outcomes arising from your use of this website and agree to release us from any liability in connection with your use of, or reliance upon, the content or products found herein.