
|
Landis+Gyr Group AG (0RTL.L) Avaliação DCF |
Totalmente Editável: Adapte-Se Às Suas Necessidades No Excel Ou Planilhas
Design Profissional: Modelos Confiáveis E Padrão Da Indústria
Pré-Construídos Para Uso Rápido E Eficiente
Compatível com MAC/PC, totalmente desbloqueado
Não É Necessária Experiência; Fácil De Seguir
Landis+Gyr Group AG (0RTL.L) Bundle
Aprimore sua estratégia de investimento com a calculadora DCF do Landis+Gyr Group AG (0RTLL)! Utilize dados financeiros reais, ajuste as projeções e despesas de crescimento e observe instantaneamente como essas modificações afetam o valor intrínseco do Landis+Gyr Group AG (0RTLL).
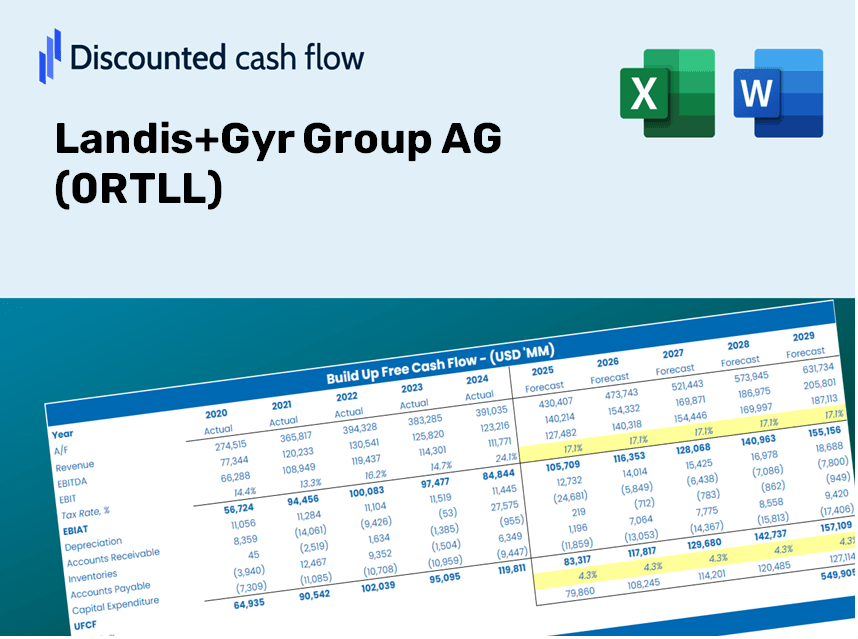
Discounted Cash Flow (DCF) - (USD MM)
| Year | AY1 2021 |
AY2 2022 |
AY3 2023 |
AY4 2024 |
AY5 2025 |
FY1 2026 |
FY2 2027 |
FY3 2028 |
FY4 2029 |
FY5 2030 |
|---|---|---|---|---|---|---|---|---|---|---|
| Revenue | 1,093.2 | 1,178.9 | 1,354.0 | 1,580.8 | 1,392.6 | 1,488.5 | 1,591.0 | 1,700.6 | 1,817.7 | 1,942.8 |
| Revenue Growth, % | 0 | 7.85 | 14.85 | 16.75 | -11.9 | 6.89 | 6.89 | 6.89 | 6.89 | 6.89 |
| EBITDA | -224.1 | 131.9 | 115.9 | 172.5 | 17.8 | 34.1 | 36.4 | 38.9 | 41.6 | 44.5 |
| EBITDA, % | -20.5 | 11.19 | 8.56 | 10.91 | 1.28 | 2.29 | 2.29 | 2.29 | 2.29 | 2.29 |
| Depreciation | 66.7 | 65.6 | 66.2 | 58.5 | 58.4 | 72.8 | 77.8 | 83.2 | 88.9 | 95.0 |
| Depreciation, % | 6.1 | 5.57 | 4.89 | 3.7 | 4.19 | 4.89 | 4.89 | 4.89 | 4.89 | 4.89 |
| EBIT | -290.8 | 66.3 | 49.7 | 113.9 | -40.6 | -38.7 | -41.4 | -44.3 | -47.3 | -50.6 |
| EBIT, % | -26.6 | 5.62 | 3.67 | 7.21 | -2.91 | -2.6 | -2.6 | -2.6 | -2.6 | -2.6 |
| Total Cash | 113.2 | 68.3 | 94.5 | 102.9 | 138.2 | 117.8 | 125.9 | 134.6 | 143.8 | 153.7 |
| Total Cash, percent | .0 | .0 | .0 | .0 | .0 | .0 | .0 | .0 | .0 | .0 |
| Account Receivables | 227.2 | 260.6 | 283.0 | 271.9 | 336.0 | 312.9 | 334.5 | 357.5 | 382.1 | 408.4 |
| Account Receivables, % | 20.78 | 22.11 | 20.9 | 17.2 | 24.12 | 21.02 | 21.02 | 21.02 | 21.02 | 21.02 |
| Inventories | 89.0 | 115.2 | 195.2 | 191.3 | 185.6 | 171.9 | 183.8 | 196.4 | 210.0 | 224.4 |
| Inventories, % | 8.14 | 9.78 | 14.41 | 12.1 | 13.32 | 11.55 | 11.55 | 11.55 | 11.55 | 11.55 |
| Accounts Payable | 102.9 | 131.5 | 173.0 | 125.0 | 162.5 | 157.5 | 168.4 | 180.0 | 192.4 | 205.6 |
| Accounts Payable, % | 9.41 | 11.16 | 12.78 | 7.9 | 11.67 | 10.58 | 10.58 | 10.58 | 10.58 | 10.58 |
| Capital Expenditure | -21.4 | -21.8 | -22.8 | -25.5 | -25.7 | -26.6 | -28.5 | -30.4 | -32.5 | -34.8 |
| Capital Expenditure, % | -1.96 | -1.85 | -1.68 | -1.61 | -1.85 | -1.79 | -1.79 | -1.79 | -1.79 | -1.79 |
| Tax Rate, % | -103.3 | -103.3 | -103.3 | -103.3 | -103.3 | -103.3 | -103.3 | -103.3 | -103.3 | -103.3 |
| EBITAT | -305.7 | 72.7 | 35.9 | 102.4 | -82.4 | -35.8 | -38.3 | -40.9 | -43.7 | -46.7 |
| Depreciation | ||||||||||
| Changes in Account Receivables | ||||||||||
| Changes in Inventories | ||||||||||
| Changes in Accounts Payable | ||||||||||
| Capital Expenditure | ||||||||||
| UFCF | -473.7 | 85.5 | 18.5 | 102.5 | -70.7 | 42.1 | -11.5 | -12.3 | -13.1 | -14.0 |
| WACC, % | 7.65 | 7.65 | 7.36 | 7.55 | 7.65 | 7.57 | 7.57 | 7.57 | 7.57 | 7.57 |
| PV UFCF | ||||||||||
| SUM PV UFCF | -.2 | |||||||||
| Long Term Growth Rate, % | 3.00 | |||||||||
| Free cash flow (T + 1) | -14 | |||||||||
| Terminal Value | -316 | |||||||||
| Present Terminal Value | -219 | |||||||||
| Enterprise Value | -219 | |||||||||
| Net Debt | 212 | |||||||||
| Equity Value | -432 | |||||||||
| Diluted Shares Outstanding, MM | 29 | |||||||||
| Equity Value Per Share | -14.95 |
What You Will Receive
- Customizable Excel Template: A comprehensive, editable DCF Calculator in Excel, featuring pre-filled financial data for Landis+Gyr Group AG (0RTLL).
- Accurate Financial Data: Access to historical records and future projections (highlighted in the designated yellow cells).
- Forecasting Ease: Adjust key assumptions such as revenue growth, EBITDA margin, and WACC to suit your analysis.
- Instant Calculations: View real-time effects of your inputs on the valuation of Landis+Gyr Group AG (0RTLL).
- Professional Resource: Designed specifically for investors, CFOs, consultants, and financial analysts.
- Intuitive Interface: Organized for straightforward navigation and usability, with clear, step-by-step guidance.
Key Features
- Customizable Forecast Inputs: Adjust essential elements such as revenue growth rates, EBITDA percentages, and capital expenditure figures.
- Instant DCF Valuation: Quickly computes intrinsic value, NPV, and various outputs with ease.
- High-Precision Accuracy: Utilizes Landis+Gyr Group AG's (0RTLL) actual financial data for reliable valuation results.
- Seamless Scenario Analysis: Effortlessly test various assumptions and analyze different outcomes.
- Efficiency Booster: Avoid the hassle of constructing intricate valuation models from the ground up.
How It Functions
- Download the Template: Gain immediate access to the Excel-based LAG DCF Calculator.
- Input Your Assumptions: Modify the yellow-highlighted cells for growth rates, WACC, profit margins, and more.
- Instant Calculations: The model automatically recalculates the intrinsic value of Landis+Gyr Group AG (0RTLL).
- Test Scenarios: Experiment with different assumptions to assess potential changes in valuation.
- Analyze and Decide: Utilize the results to inform your investment or financial strategy.
Why Choose This Calculator?
- User-Friendly Interface: Perfectly crafted for both novices and seasoned professionals.
- Customizable Inputs: Adapt parameters easily to suit your specific analysis.
- Real-Time Feedback: Instantly observe changes in Landis+Gyr Group AG's (0RTLL) valuation as you modify inputs.
- Preloaded Data: Comes with Landis+Gyr Group AG's (0RTLL) actual financial information for swift evaluations.
- Endorsed by Experts: A go-to tool for investors and analysts for making well-informed decisions.
Who Should Utilize This Product?
- Individual Investors: Make well-informed decisions regarding the purchase or sale of Landis+Gyr Group AG (0RTLL) shares.
- Financial Analysts: Enhance valuation processes with accessible financial models tailored for Landis+Gyr Group AG (0RTLL).
- Consultants: Provide clients with precise and timely valuation insights related to Landis+Gyr Group AG (0RTLL).
- Business Owners: Gain insights into the valuation of large companies like Landis+Gyr Group AG (0RTLL) to inform your own business strategies.
- Finance Students: Acquire valuation skills using real-world data and scenarios centered around Landis+Gyr Group AG (0RTLL).
Contents of the Template
- Pre-Filled DCF Model: Financial data for Landis+Gyr Group AG (0RTLL) preloaded for immediate analysis.
- WACC Calculator: Comprehensive calculations for the Weighted Average Cost of Capital.
- Financial Ratios: Assess Landis+Gyr's profitability, leverage, and operational efficiency.
- Editable Inputs: Customize assumptions like growth rates, margins, and CAPEX to suit your analysis.
- Financial Statements: Access annual and quarterly reports for in-depth evaluation.
- Interactive Dashboard: Effortlessly visualize essential valuation metrics and outcomes.
Disclaimer
All information, articles, and product details provided on this website are for general informational and educational purposes only. We do not claim any ownership over, nor do we intend to infringe upon, any trademarks, copyrights, logos, brand names, or other intellectual property mentioned or depicted on this site. Such intellectual property remains the property of its respective owners, and any references here are made solely for identification or informational purposes, without implying any affiliation, endorsement, or partnership.
We make no representations or warranties, express or implied, regarding the accuracy, completeness, or suitability of any content or products presented. Nothing on this website should be construed as legal, tax, investment, financial, medical, or other professional advice. In addition, no part of this site—including articles or product references—constitutes a solicitation, recommendation, endorsement, advertisement, or offer to buy or sell any securities, franchises, or other financial instruments, particularly in jurisdictions where such activity would be unlawful.
All content is of a general nature and may not address the specific circumstances of any individual or entity. It is not a substitute for professional advice or services. Any actions you take based on the information provided here are strictly at your own risk. You accept full responsibility for any decisions or outcomes arising from your use of this website and agree to release us from any liability in connection with your use of, or reliance upon, the content or products found herein.