
|
Sparebank 1 Ostlandet (0ru6.l) Avaliação DCF |
Totalmente Editável: Adapte-Se Às Suas Necessidades No Excel Ou Planilhas
Design Profissional: Modelos Confiáveis E Padrão Da Indústria
Pré-Construídos Para Uso Rápido E Eficiente
Compatível com MAC/PC, totalmente desbloqueado
Não É Necessária Experiência; Fácil De Seguir
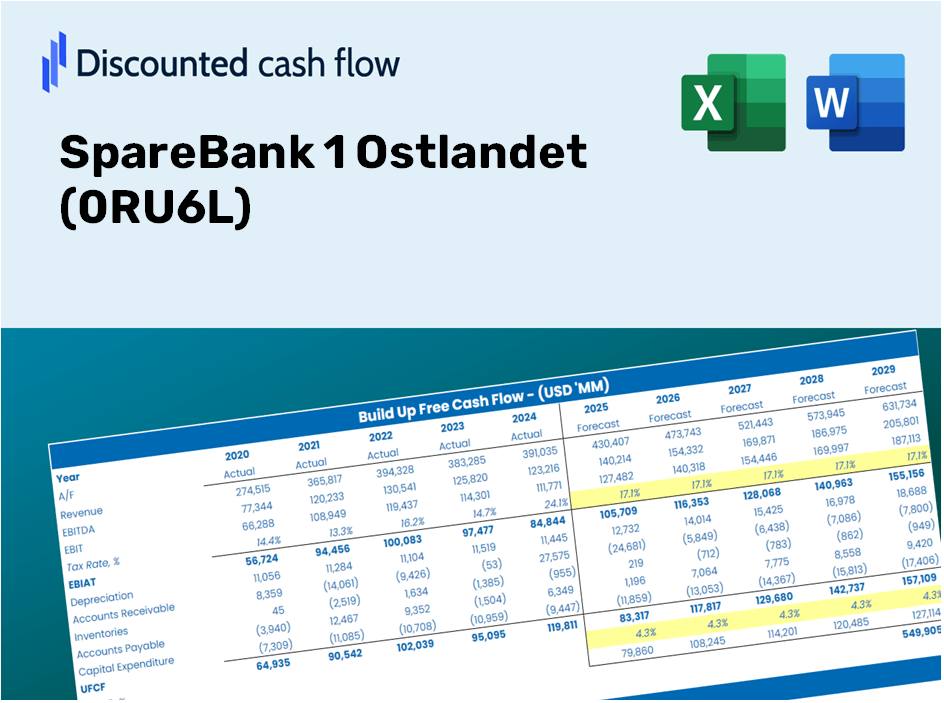
SpareBank 1 Ostlandet (0RU6.L) Bundle
Avalie as perspectivas financeiras da Sparebank 1 Ostlandet como um especialista! Esta calculadora DCF (0RU6L) vem com dados financeiros pré-carregados e oferece flexibilidade total para modificar o crescimento da receita, o WACC, as margens de lucro e outras suposições essenciais para corresponder às suas projeções.
Discounted Cash Flow (DCF) - (USD MM)
| Year | AY1 2020 |
AY2 2021 |
AY3 2022 |
AY4 2023 |
AY5 2024 |
FY1 2025 |
FY2 2026 |
FY3 2027 |
FY4 2028 |
FY5 2029 |
|---|---|---|---|---|---|---|---|---|---|---|
| Revenue | 3,720.0 | 3,931.0 | 4,259.0 | 5,037.0 | 6,647.0 | 7,714.6 | 8,953.7 | 10,391.8 | 12,060.9 | 13,998.1 |
| Revenue Growth, % | 0 | 5.67 | 8.34 | 18.27 | 31.96 | 16.06 | 16.06 | 16.06 | 16.06 | 16.06 |
| EBITDA | 1,670.0 | 2,155.0 | 2,315.0 | 2,940.0 | 4,206.0 | 4,254.0 | 4,937.3 | 5,730.3 | 6,650.7 | 7,718.9 |
| EBITDA, % | 44.89 | 54.82 | 54.36 | 58.37 | 63.28 | 55.14 | 55.14 | 55.14 | 55.14 | 55.14 |
| Depreciation | 132.0 | 122.0 | 122.0 | 131.0 | 154.0 | 222.7 | 258.5 | 300.0 | 348.2 | 404.1 |
| Depreciation, % | 3.55 | 3.1 | 2.86 | 2.6 | 2.32 | 2.89 | 2.89 | 2.89 | 2.89 | 2.89 |
| EBIT | 1,538.0 | 2,033.0 | 2,193.0 | 2,809.0 | 4,052.0 | 4,031.3 | 4,678.8 | 5,430.3 | 6,302.5 | 7,314.8 |
| EBIT, % | 41.34 | 51.72 | 51.49 | 55.77 | 60.96 | 52.26 | 52.26 | 52.26 | 52.26 | 52.26 |
| Total Cash | 683.0 | 458.0 | 677.0 | 677.0 | 567.0 | 1,047.3 | 1,215.5 | 1,410.7 | 1,637.3 | 1,900.3 |
| Total Cash, percent | .0 | .0 | .0 | .0 | .0 | .0 | .0 | .0 | .0 | .0 |
| Account Receivables | .0 | .0 | .0 | .0 | 39.0 | 9.1 | 10.5 | 12.2 | 14.2 | 16.4 |
| Account Receivables, % | 0 | 0 | 0 | 0 | 0.58673 | 0.11735 | 0.11735 | 0.11735 | 0.11735 | 0.11735 |
| Inventories | .0 | .0 | .0 | .0 | .0 | .0 | .0 | .0 | .0 | .0 |
| Inventories, % | 0 | 0 | 0 | 0 | 0 | 0 | 0 | 0 | 0 | 0 |
| Accounts Payable | 74.0 | 86.0 | 103.0 | 115.0 | 128.0 | 166.7 | 193.5 | 224.6 | 260.6 | 302.5 |
| Accounts Payable, % | 1.99 | 2.19 | 2.42 | 2.28 | 1.93 | 2.16 | 2.16 | 2.16 | 2.16 | 2.16 |
| Capital Expenditure | -60.0 | -90.0 | .0 | -101.0 | -232.0 | -145.0 | -168.3 | -195.3 | -226.7 | -263.1 |
| Capital Expenditure, % | -1.61 | -2.29 | 0 | -2.01 | -3.49 | -1.88 | -1.88 | -1.88 | -1.88 | -1.88 |
| Tax Rate, % | 17.92 | 17.92 | 17.92 | 17.92 | 17.92 | 17.92 | 17.92 | 17.92 | 17.92 | 17.92 |
| EBITAT | 1,275.3 | 1,678.6 | 1,776.3 | 2,189.9 | 3,326.0 | 3,277.7 | 3,804.2 | 4,415.2 | 5,124.4 | 5,947.4 |
| Depreciation | ||||||||||
| Changes in Account Receivables | ||||||||||
| Changes in Inventories | ||||||||||
| Changes in Accounts Payable | ||||||||||
| Capital Expenditure | ||||||||||
| UFCF | 1,421.3 | 1,722.6 | 1,915.3 | 2,231.9 | 3,222.0 | 3,424.1 | 3,919.7 | 4,549.3 | 5,280.0 | 6,128.0 |
| WACC, % | 9.12 | 9.08 | 8.94 | 8.66 | 9.04 | 8.97 | 8.97 | 8.97 | 8.97 | 8.97 |
| PV UFCF | ||||||||||
| SUM PV UFCF | 17,692.9 | |||||||||
| Long Term Growth Rate, % | 2.00 | |||||||||
| Free cash flow (T + 1) | 6,251 | |||||||||
| Terminal Value | 89,706 | |||||||||
| Present Terminal Value | 58,389 | |||||||||
| Enterprise Value | 76,082 | |||||||||
| Net Debt | 51,786 | |||||||||
| Equity Value | 24,296 | |||||||||
| Diluted Shares Outstanding, MM | 119 | |||||||||
| Equity Value Per Share | 203.88 |
What You Will Receive
- Comprehensive Financial Model: Leverage SpareBank 1 Ostlandet’s real data for accurate DCF valuation.
- Complete Forecasting Control: Modify revenue growth, profit margins, WACC, and other critical parameters.
- Real-Time Calculations: Automatic updates allow you to view results instantly as you make adjustments.
- Professional-Grade Template: A polished Excel file crafted for high-quality valuation presentations.
- Flexible and Reusable: Designed for adaptability, enabling repeated use for in-depth forecasts.
Key Features
- Pre-Loaded Data: SpareBank 1 Ostlandet's historical financial statements and pre-filled forecasts.
- Fully Adjustable Inputs: Modify WACC, tax rates, revenue growth, and EBITDA margins as needed.
- Instant Results: View SpareBank 1 Ostlandet's intrinsic value recalculating in real time.
- Clear Visual Outputs: Dashboard charts showcase valuation results and essential metrics.
- Built for Accuracy: A professional-grade tool for analysts, investors, and finance specialists.
How It Works
- Step 1: Download the Excel file for SpareBank 1 Ostlandet (0RU6L).
- Step 2: Review the pre-filled financial data and forecasts related to SpareBank 1 Ostlandet (0RU6L).
- Step 3: Adjust key inputs such as revenue growth, WACC, and tax rates (highlighted cells) for SpareBank 1 Ostlandet (0RU6L).
- Step 4: Observe the DCF model refresh in real-time as you modify your assumptions.
- Step 5: Evaluate the outputs and utilize the findings to inform your investment strategies for SpareBank 1 Ostlandet (0RU6L).
Why Choose This Calculator for SpareBank 1 Ostlandet (0RU6L)?
- Reliable Data: Utilize authentic SpareBank 1 Ostlandet financials for dependable valuation outcomes.
- Flexible Settings: Tailor essential variables such as growth projections, WACC, and tax rates to fit your analysis.
- Efficient: Pre-configured calculations help you avoid starting from square one.
- Professional-Quality Tool: Crafted for investors, analysts, and consultants in the finance sector.
- Easy to Use: User-centered design with straightforward instructions ensures accessibility for everyone.
Who Can Benefit from SpareBank 1 Ostlandet (0RU6L)?
- Investors: Make informed investment choices with a top-tier valuation tool.
- Financial Analysts: Enhance efficiency with a customizable pre-built DCF model.
- Consultants: Easily modify the template for client reports or presentations.
- Finance Enthusiasts: Expand your knowledge of valuation methods through practical examples.
- Educators and Students: Utilize it as an effective educational resource in finance courses.
Contents of the Template
- Operating and Balance Sheet Data: Pre-filled historical data and forecasts for SpareBank 1 Ostlandet (0RU6L), including metrics such as revenue, EBITDA, EBIT, and capital expenditures.
- WACC Calculation: A dedicated worksheet for calculating the Weighted Average Cost of Capital (WACC), featuring parameters like Beta, risk-free rate, and share price.
- DCF Valuation (Unlevered and Levered): Customizable Discounted Cash Flow models displaying intrinsic value with comprehensive calculations.
- Financial Statements: Pre-loaded annual and quarterly financial statements to facilitate thorough analysis.
- Key Ratios: Includes profitability, leverage, and efficiency ratios specifically for SpareBank 1 Ostlandet (0RU6L).
- Dashboard and Charts: A visual summary of valuation outputs and assumptions, enabling easy analysis of results.
Disclaimer
All information, articles, and product details provided on this website are for general informational and educational purposes only. We do not claim any ownership over, nor do we intend to infringe upon, any trademarks, copyrights, logos, brand names, or other intellectual property mentioned or depicted on this site. Such intellectual property remains the property of its respective owners, and any references here are made solely for identification or informational purposes, without implying any affiliation, endorsement, or partnership.
We make no representations or warranties, express or implied, regarding the accuracy, completeness, or suitability of any content or products presented. Nothing on this website should be construed as legal, tax, investment, financial, medical, or other professional advice. In addition, no part of this site—including articles or product references—constitutes a solicitation, recommendation, endorsement, advertisement, or offer to buy or sell any securities, franchises, or other financial instruments, particularly in jurisdictions where such activity would be unlawful.
All content is of a general nature and may not address the specific circumstances of any individual or entity. It is not a substitute for professional advice or services. Any actions you take based on the information provided here are strictly at your own risk. You accept full responsibility for any decisions or outcomes arising from your use of this website and agree to release us from any liability in connection with your use of, or reliance upon, the content or products found herein.