
|
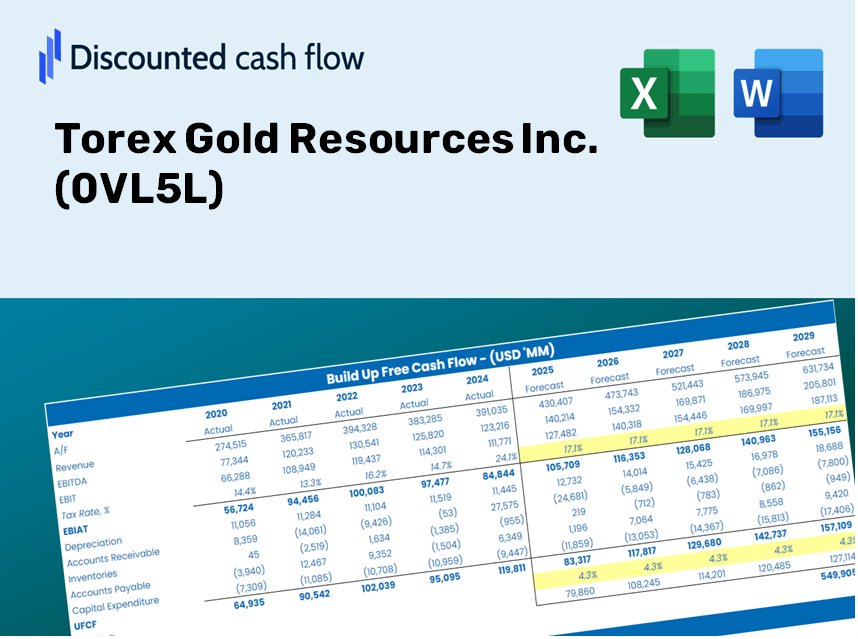
Torex Gold Resources Inc. (0vl5.l) Avaliação DCF |
Totalmente Editável: Adapte-Se Às Suas Necessidades No Excel Ou Planilhas
Design Profissional: Modelos Confiáveis E Padrão Da Indústria
Pré-Construídos Para Uso Rápido E Eficiente
Compatível com MAC/PC, totalmente desbloqueado
Não É Necessária Experiência; Fácil De Seguir
Torex Gold Resources Inc. (0VL5.L) Bundle
Aproveite o poder da análise de avaliação da Torex Gold Resources Inc. (0VL5L) com nossa calculadora DCF de última geração! Este modelo do Excel é pré -carregado com dados reais para (0VL5L), permitindo que você ajuste as previsões e suposições para determinar com precisão o valor intrínseco da Torex Gold Resources Inc.
What You Will Receive
- Authentic Torex Data: Comprehensive financial figures – from revenue to EBIT – based on actual and projected statistics.
- Complete Customization: Modify all essential parameters (yellow cells) such as WACC, growth %, and tax rates.
- Immediate Valuation Revisions: Automatic recalculations to assess the effect of changes on Torex Gold’s fair value.
- Adaptable Excel Template: Designed for quick modifications, scenario analysis, and detailed forecasting.
- Efficient and Precise: Avoid building models from scratch while ensuring accuracy and flexibility.
Key Features
- Customizable Forecast Parameters: Adjust vital metrics such as gold production rates, operating costs, and capital expenditures.
- Instant DCF Valuation: Quickly determines intrinsic value, NPV, and other essential outputs with ease.
- Industry-Leading Accuracy: Leverages Torex Gold Resources Inc.’s (0VL5L) real-world financial data for precise valuation results.
- Effortless Scenario Analysis: Easily explore various assumptions and evaluate outcomes in a straightforward manner.
- Efficiency Boost: Avoid the hassle of constructing intricate valuation models from the ground up.
How It Functions
- Download the Template: Gain immediate access to the Excel-based Torex Gold DCF Calculator (0VL5L).
- Input Your Assumptions: Modify the highlighted cells in yellow for growth rates, WACC, margins, and other variables.
- Instant Calculations: The model automatically recalculates Torex Gold’s intrinsic value.
- Test Scenarios: Experiment with different assumptions to assess potential changes in valuation.
- Analyze and Decide: Utilize the results to inform your investment or financial decision-making process.
Why Choose the Torex Gold Resources Inc. Calculator?
- Accuracy: Based on real Torex Gold financials for precise data.
- Flexibility: Users can easily test and adjust inputs as needed.
- Time-Saving: Avoid the complexities of constructing a DCF model from the ground up.
- Professional-Grade: Crafted with the meticulousness and usability expected by CFOs.
- User-Friendly: Intuitive design ensures accessibility for all, regardless of financial modeling expertise.
Who Can Benefit from This Product?
- Investors: Make informed decisions with a top-tier valuation tool designed for professionals.
- Financial Analysts: Streamline your workflow with a customizable pre-set DCF model.
- Consultants: Easily modify the template for effective client presentations or detailed reports.
- Finance Enthusiasts: Enhance your knowledge of valuation methods through practical, real-world examples.
- Educators and Students: Utilize this as a hands-on resource in finance-focused courses.
Contents of the Template
- Pre-Filled DCF Model: Torex Gold Resources Inc.'s (0VL5L) financial data ready for immediate application.
- WACC Calculator: Comprehensive calculations for the Weighted Average Cost of Capital.
- Financial Ratios: Assess Torex Gold's profitability, leverage, and operational efficiency.
- Editable Inputs: Modify assumptions such as growth rates, profit margins, and capital expenditures to suit your scenarios.
- Financial Statements: Access to annual and quarterly reports for in-depth analysis.
- Interactive Dashboard: Effortlessly visualize essential valuation metrics and outcomes.
Disclaimer
All information, articles, and product details provided on this website are for general informational and educational purposes only. We do not claim any ownership over, nor do we intend to infringe upon, any trademarks, copyrights, logos, brand names, or other intellectual property mentioned or depicted on this site. Such intellectual property remains the property of its respective owners, and any references here are made solely for identification or informational purposes, without implying any affiliation, endorsement, or partnership.
We make no representations or warranties, express or implied, regarding the accuracy, completeness, or suitability of any content or products presented. Nothing on this website should be construed as legal, tax, investment, financial, medical, or other professional advice. In addition, no part of this site—including articles or product references—constitutes a solicitation, recommendation, endorsement, advertisement, or offer to buy or sell any securities, franchises, or other financial instruments, particularly in jurisdictions where such activity would be unlawful.
All content is of a general nature and may not address the specific circumstances of any individual or entity. It is not a substitute for professional advice or services. Any actions you take based on the information provided here are strictly at your own risk. You accept full responsibility for any decisions or outcomes arising from your use of this website and agree to release us from any liability in connection with your use of, or reliance upon, the content or products found herein.